
Mind map
Roots
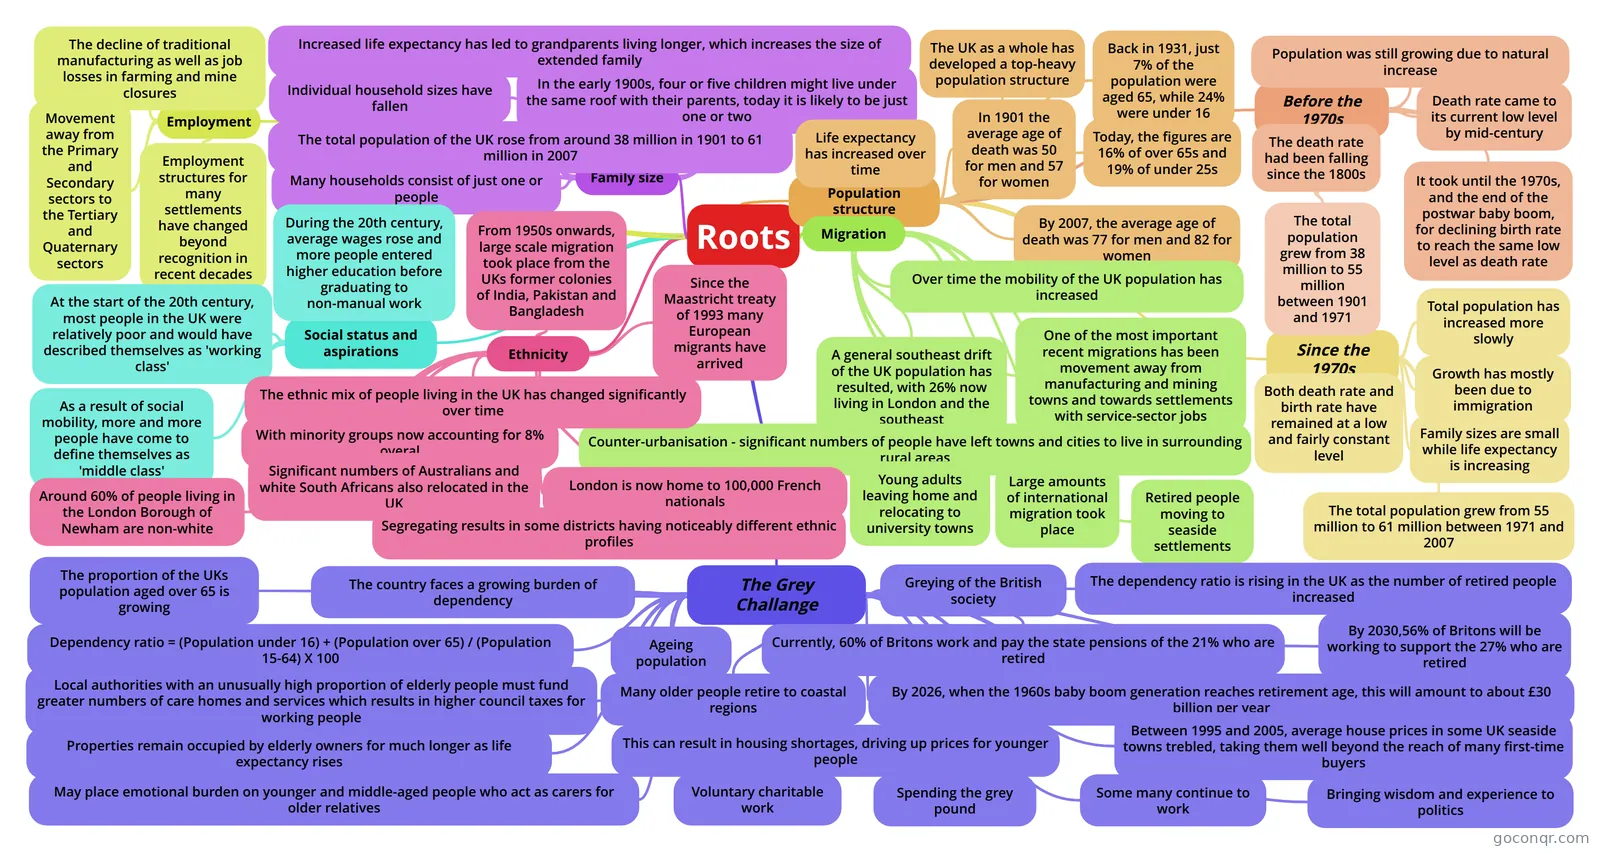
Mind map: UK population change mind map
Map content
Roots
Family size
- The total population of the UK rose from around 38 million in 1901 to 61 million in 2007
- Individual household sizes have fallen
- In the early 1900s, four or five children might live under the same roof with their parents, today it is likely to be just one or two
- Many households consist of just one or people
- Increased life expectancy has led to grandparents living longer, which increases the size of extended family
Population structure
- The UK as a whole has developed a top-heavy population structure
- Back in 1931, just 7% of the population were aged 65, while 24% were under 16
- Today, the figures are 16% of over 65s and 19% of under 25s
- Life expectancy has increased over time
- In 1901 the average age of death was 50 for men and 57 for women
- By 2007, the average age of death was 77 for men and 82 for women
- Before the 1970s
- Population was still growing due to natural increase
- The death rate had been falling since the 1800s
- The total population grew from 38 million to 55 million between 1901 and 1971
- Death rate came to its current low level by mid-century
- It took until the 1970s, and the end of the postwar baby boom, for declining birth rate to reach the same low level as death rate
- Since the 1970s
- Total population has increased more slowly
- Growth has mostly been due to immigration
- Both death rate and birth rate have remained at a low and fairly constant level
- Family sizes are small while life expectancy is increasing
- The total population grew from 55 million to 61 million between 1971 and 2007
Migration
- Over time the mobility of the UK population has increased
- One of the most important recent migrations has been movement away from manufacturing and mining towns and towards settlements with service-sector jobs
- A general southeast drift of the UK population has resulted, with 26% now living in London and the southeast
- Counter-urbanisation - significant numbers of people have left towns and cities to live in surrounding rural areas
- Retired people moving to seaside settlements
- Young adults leaving home and relocating to university towns
- Large amounts of international migration took place
Employment
- Employment structures for many settlements have changed beyond recognition in recent decades
- The decline of traditional manufacturing as well as job losses in farming and mine closures
- Movement away from the Primary and Secondary sectors to the Tertiary and Quaternary sectors
Social status and aspirations
- At the start of the 20th century, most people in the UK were relatively poor and would have described themselves as 'working class'
- During the 20th century, average wages rose and more people entered higher education before graduating to non-manual work
- As a result of social mobility, more and more people have come to define themselves as 'middle class'
Ethnicity
- The ethnic mix of people living in the UK has changed significantly over time
- With minority groups now accounting for 8% overal
- From 1950s onwards, large scale migration took place from the UKs former colonies of India, Pakistan and Bangladesh
- Significant numbers of Australians and white South Africans also relocated in the UK
- Since the Maastricht treaty of 1993 many European migrants have arrived
- London is now home to 100,000 French nationals
- Segregating results in some districts having noticeably different ethnic profiles
- Around 60% of people living in the London Borough of Newham are non-white
The Grey Challange
- The proportion of the UKs population aged over 65 is growing
- Ageing population
- Greying of the British society
- The country faces a growing burden of dependency
- Dependency ratio = (Population under 16) + (Population over 65) / (Population 15-64) X 100
- The dependency ratio is rising in the UK as the number of retired people increased
- Currently, 60% of Britons work and pay the state pensions of the 21% who are retired
- By 2030,56% of Britons will be working to support the 27% who are retired
- By 2026, when the 1960s baby boom generation reaches retirement age, this will amount to about £30 billion per year
- Local authorities with an unusually high proportion of elderly people must fund greater numbers of care homes and services which results in higher council taxes for working people
- Many older people retire to coastal regions
- Properties remain occupied by elderly owners for much longer as life expectancy rises
- This can result in housing shortages, driving up prices for younger people
- Between 1995 and 2005, average house prices in some UK seaside towns trebled, taking them well beyond the reach of many first-time buyers
- May place emotional burden on younger and middle-aged people who act as carers for older relatives
- Voluntary charitable work
- Spending the grey pound
- Some many continue to work
- Bringing wisdom and experience to politics
Information
- Description
- A-Levels Geography (Going Global) Mind Map on Roots, created by Jodie Goodacre on 05/05/2013.
- Created by
- Jodie Goodacre
- Views
- 173
- Tags
- Rating