Description

|
|
Created by Michael Riben
over 12 years ago
|
|
Page 1
Learning in humans Features Symptom versus diseases - A symptom may be a part of a disease but does not necessarily mean a disease is present if symptom is identified. Disease--> Symptom is identifying the symptoms of a disease is done by scientific observation. Symptoms==> disease is practiced by clinicians to identify what disease process is present in a patientVariability - symptoms usually show great variability even for patient's with same disease. Symptoms and measurements determined for the same disease category can be correlated and expressed statisticallyFeature Selection- We call signs, symptoms, measurements and results of diagnostic test features Computer diagnosis or decision = classificationDecision models = assist in feature selection , principle part of training computers for decision supportFeatures vs. Decision models --> decision model helps in selecting the best features --> and then we optimize it based on the best features -- similar to detection theory. To train using a training set, we enter features of set of patients with different diseases into the computer , and then we can as it to classify /categorize patients into disease groups based on the decision modelSupervised Learning -> the teacher/programmer tells the computer the disease or health status of each patient in the training set. Computer orders features based on discriminatory power --> what is best feature to discriminate between A and B, 2nd best, 3rd best etc..The teacher /supervisor determines basis of the results of the teaching features and how many features are to be used in the decision modelUn-supervised learning -Also give the features in the training set to computer but "truth " is unknown. Computer determines what clusters of feature sets the different dz groups can be characterized by.==> CLUSTERINGIf two groups are discernable without supervision, then there is enough feature non-overlap. If the features overlap considerably, then there is no unsupervised learning mechanism to discern the two and only supervised learning can be used to discern two groups
Clinical Decision Support Systems (CDSS): Computer applications that support and assist clinicians in improved decision-making by providing evidence-based knowledge with respect to patient data. This type of computer-based system consists of three components: a language system, a knowledge system and a problem processing system [1][3].Intelligent Decision Support System (IDSS): Intelligent decision support is provided by a system that helps in decision-making through a display of intelligent behavior that may include learning and reasoning. Such learning and reasoning can be achieved through implementing rule-based expert systems, knowledge-based systems or neural network systems [2].Artificial intelligence (AI): AI refers to the art of empowering computers with intelligence similar to that of humans. This is achieved by combining hardware and software systems so they can perform tasks that are rule-based and require decision-making [3].Artificial Neural Network (ANN): A mathematical model that simulates the structure and functional aspects of biological neural networks. It mimics in a simplified way how the human brain processes information. Composed of a number of highly connected processing elements (neurons/nodes), ANNs, like people, learn by example. ANNs have the ability to identify meaning from complicated data and to extract patterns and trends that are too complex to be noticed by either humans or other computer-based techniques. A trained ANN can be an “expert” in the category of information it has been given to analyze. This “expert” can subsequently be used to predict and answer “what if” questions in a new situation of interest [3
Intelligent decision support systems can help in multiple ways in clinical decision-making at both the individual patient level and the population level. For example: Diagnose by regularly interpreting and monitoring patient data. An IDSS can implement rules and patterns for individual patients, based on clinical parameters, and raise warning flags when such rules are violated. These flags can lead to clinical interventions that save lives. Help chronic disease management through establishing benchmarks and alerts. For chronically ill patients, a deviation noticed by an IDSS in, say, a blood test reading from a diabetic patient could result in an intervention before the patient gets into difficulty. Help public health surveillance by detecting pandemic diseases or in surveillance of chronic diseases. In case of a pandemic, an IDSS can interpret data and predict possible future spread of the disease. Additionally, IDSS can perform regular clinical decision support functions like preventing drug-drug interactions. Even if not noticed by the prescribing physician, an IDSS can spot incompatibilities between prescribed medications and/or dosages for the patient.
Prior Probability = Prevalence
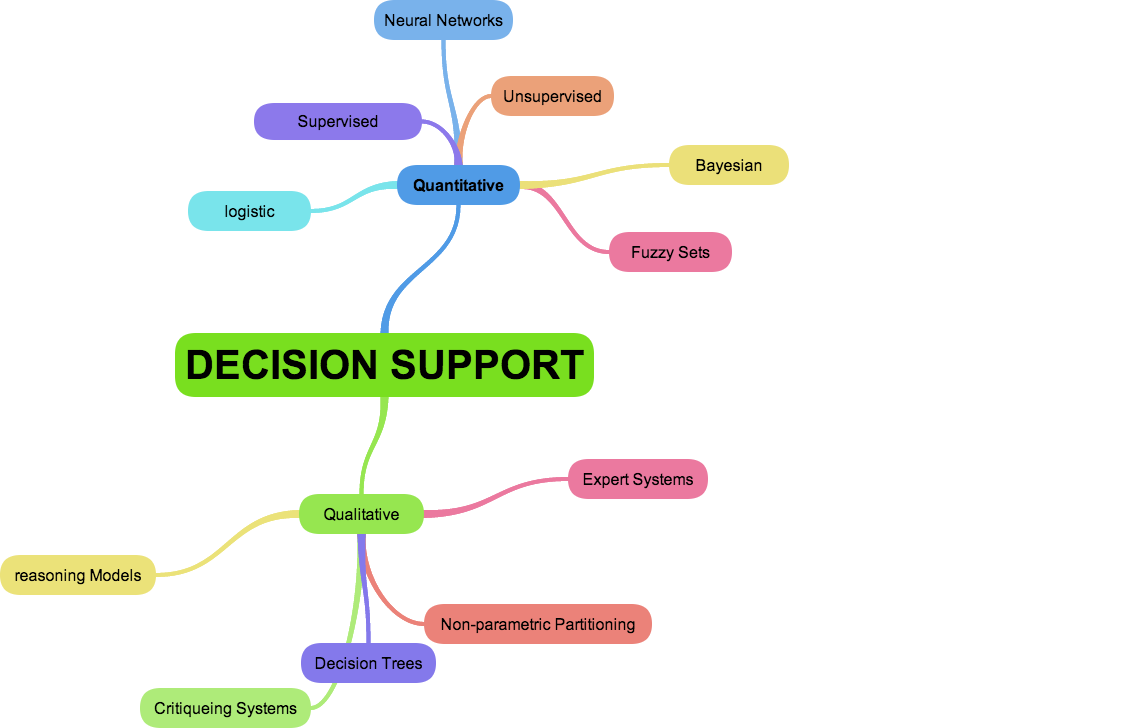
Quantitative Decision Support Models = based on well defined statistical models , uses training sets of data, features are selected using statistical methods, prior proabilities are incorporated into the statistical models - i.e. BAYE'S RULE
Qualitative Decision Support Models =uses features proposed by experts and based on clinical studies - generally use "symbolic reasoning methods such as "logical deduction" understood best by "boolean logic" - MOST KNOWLEDGE BASES ARE QUALITATIVE , Symbolic reasoning methods
Bayesian networks - combination of both quantitative and qualitative methods: imposes probabilistic models that quantify strengths of relationships among particular events. , these events in turn may appear in the model that defines particular states of the world and that uses either a quantitative (probabilistic) or qualitative (symbolic logic) reasoning methods.
Statistical methods are generally used to test the probability of the occurrence of some event For statistical approaches 1) test whether normal/healthy is more probable than disease, or whether A disease is more probable than B disease
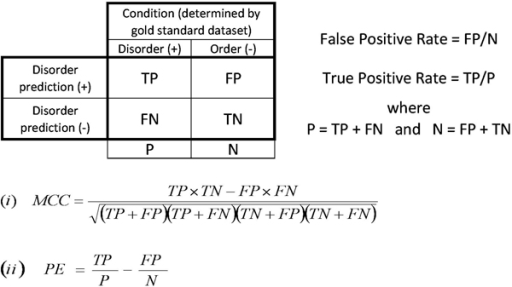
Figure 3: Contingency table and common performance measurements. The abbreviations are for the number of true positive (TP), false positive (FP), false negative (FN) and true negative (TN) predictions. The False Positive Rate (FPR) was calculated as FP/(FP+TN) and the True Positive Rate (TPR) as TP/(TP+FN). The Matthews Correlation Coefficient (MCC) is shown in equation (i) and the probability excess (PE) in equation (ii).
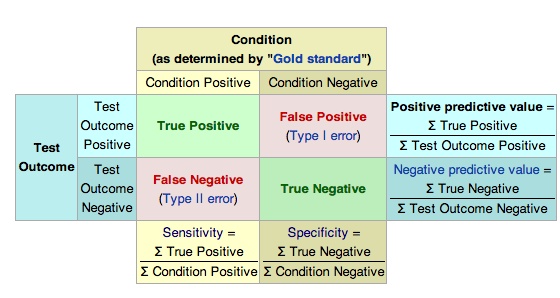
Imagine a study evaluating a new test that screens people for a disease. Each person taking the test either has or does not have the disease. The test outcome can be positive (predicting that the person has the disease) or negative (predicting that the person does not have the disease). The test results for each subject may or may not match the subject's actual status. In that setting: True positive: Sick people correctly diagnosed as sick False positive: Healthy people incorrectly identified as sick True negative: Healthy people correctly identified as healthy False negative: Sick people incorrectly identified as healthy In general, Positive = identified and negative = rejected. Therefore: True positive = correctly identified False positive = incorrectly identified True negative = correctly rejected False negative = incorrectly rejected In statistics and diagnostic testing, the positive predictive value, or precision rate is the proportion of positive test results that are true positives (such as correct diagnoses). It is a critical measure of the performance of a diagnostic method, as it reflects the probability that a positive test reflects the underlying condition being tested for. Its value does however depend on the prevalence of the outcome of interest, which may be unknown for a particular target population. The PPV can be derived using Bayes' theorem.
Decision Threshold - depending on what is used can shift the FP and FN.We can Visualize this with an ROC curve. However, the two populations can not be minimized independently.
In signal detection theory, a receiver operating characteristic (ROC), or simply ROC curve, is a graphical plot which illustrates the performance of a binary classifier system as its discrimination threshold is varied. It is created by plotting the fraction of true positives out of the positives (TPR = true positive rate) vs. the fraction of false positives out of the negatives (FPR = false positive rate), at various threshold settings. TPR is also known as sensitivity (also called recall in some fields), and FPR is one minus the specificity or true negative rate. In general, if both of the probability distributions for detection and false alarm are known, the ROC curve can be generated by plotting the Cumulative Distribution Function (area under the probability distribution from -inf to +inf) of the detection probability in the y-axis versus the Cumulative Distribution Function of the false alarm probability in x-axis.ROC analysis provides tools to select possibly optimal models and to discard suboptimal ones independently from (and prior to specifying) the cost context or the class distribution. ROC analysis is related in a direct and natural way to cost/benefit analysis of diagnostic decision making.The ROC curve was first developed by electrical engineers and radar engineers during World War II for detecting enemy objects in battlefields and was soon introduced to psychology to account for perceptual detection of stimuli. ROC analysis since then has been used in medicine, radiology, biometrics, and other areas for many decades and is increasingly used in machine learning and data mining research.
The less the distributions overlap, the better the ROC approaches the idealThe more the distributions overlap, the worse it affects the ROC from idealPerformance of any decision model is primarily determined byt he discriminatory power of the featuresTherefore the principal task in developing a decision model is finding the most discriminatory features and that will yield optimal performance
Bayes Rule -Prior Probability is the prevalence of a diseasePosterior Probability = prior probability and knowledge of the conditional probability of the symptoms of a disease
Unlike quantitative decision support models, Qualitative models do not have formal mathematical basis. Heuristic Methods- describes a problem solving approach that perform deductions on symbolic models using logical operations ( ==> rule bases reasoning ) to conclude a diagnosis based on a case modelUse simple single feature statistical decisions problems that are each represented by boolean logic as true or falseThere are three strategies for heuristic decisions with computers: 1) Use all micro-decisions simultaneously - Decision Tables or Truth Tables2) Use micro-decisions in sequential manner --> Decision Trees or Flow Charts3) Use the micro-decisions expressed in situation action rules (rule based or qualitative reasoning
Decision Tables - Takes all micro-decisions into account all at onceThese can be visualized using Venn Diagrams or Karnaugh DiagramsOptimization is difficult and only validation of the truth table by an independent test may confirm acceptable perfromance
FlowCharts - have more knowledge than a truth table because it is sequenced. All decisions are binary true or false and input yield one of those two outputs . A flow chart is a decision tree that is upside down.Advantages: Efficiently processed as not all micro-decisions need to be considered at once.Disadvantage: Rigid decision making, no return possible if wrong path taken . Need to test extensively prior to practical use. Training of a logical based method is difficult
Non-parametric Partitioning Algorithm - assist in building a decision tree with help a learning set which follows more or less a similar strategy as feature ranking according to the discriminatory power of the features
CART = Classification and Regression Trees is a form of Nonparametric partitioning algorithm = basically it searches for the most discriminatory feature and begins the base node at the root of the tree. and then looks for the most discriminatory feature at each branch of the first decision node and continues until all cases in the learning set are correctly classified - usually very large and must be pruned where you accept some FP and FN cases
Rule based systems are essentially systems that un-couple the knowledge contained in the micro-decisions from the structure of the decision model. The rules are contained in a "knowledge Base"Heuristic reasoning - If we have patient Database and Rules Knowledge base, we should possible to reason about the two to come to conclusionsThe procedure is called --> INFERENCE MECHANISM
Inferencing- Two types exists:1) Forward Reasoning2) Backward ReasoningIn both cases, data on the case that is being reasoned about causes the inference mechanism to select one or more rules from the knowledge base that can reason on the data==> could call more rules or ask for more data
Forward Reasoning -we start with the patient data from the patient database and then check the rules knowledge base whether there are any production rules that use the data to make inferences, if so, they are executed. The conclusions from these are added to the data set, and additional rules are triggered if they are dependent on the new data just added. => ALSO CALLED DATA DRIVEN REASONING. Once no more rules are triggered, program stops.
Backward Reasoning - inference mechanism selects rules from the knowledge bases and checks whether data are available in the patient database for inferencing. Inferencing starts with a single rule ("the Goal Rule") and determines if the goal rule is true . If not, then the backward reasoner determines whether there are any rules at all in the knowledge base that the data supports. "goal driven reasoning"This goal driven reasoning continues recursively until either goal rule is proven to be false or until all premises of the goal rule are known to be true
If not a lot of data is known about a case, then better to start with the data first, and have that data trigger rules in the knowledge base (forward) but if there is a lot of data known about the case, better to start with the backward reasoning as it prevents a myriad of production rules from firing and is more efficient
Semantic Networks and Frame Structures: knowledge is constructed by developing concepts with attributes . Inheritance mechanism known as "inheritance" allows decision support system to derive conclusions about certain frames that are related to each other in a hierarchical manner
Structure of a Knowledge base system -->separation of case data , the domain knowledge, and inferencing mechanism. A knowledge acquisition program builds and maintains the knowledge base. May also contain "explicatory" module to help justify recommendations.
Critiquing system - silent whenever the computer judges the users planned behavior to be satisfactory but offer a critique when the planned behavior proposed will take an action that is not consistent with decision support system .
Criteria for Accepting an Expert system into Clinical Practice Support of data acquisition -. i.e. Medical imaging systems for collecting data that can not be acquired any other way Data Reduction - If the data stream is too large to be comprehended, the system can reduce, transform , and present comprehensible manner Data Validation systems - i.e. in LAb Drug interaction checking- dose, duration, and contraindications Data reliability systems EEG interpretation
DSS are useful when they: offer guidance to inexperienced users in making complex decisions Give support to experienced users in suggesting diagnostic statements in case of routine interpretation Give assistance to diagnosis in non-routine cases Integrate critiquing systems with CPR(EMR)
Computers can be misused in clinical Practice: users may not be qualified to use a system safely or efficaciously Users may be qualified but not trained well to use a system for its strengths and weaknesses Systems that work in isolation may be improperly tied to other systems or a network that provided erroneous or improper inputs Poor judgement of users in deciding not use a system when it should be used or not over-riding incorrect suggestions.
Legal Aspects of using them incorrectly Not upholding the standard of care Negligence theory and Strict Product liability
Negligence Theory - service providers must uphold the standards of the community for quality and reliability in delivering services. if not, they are liable in a court of law.
Strict Product Liability - applies when the purchaser of a product is harmed from a defect in the product= Standard is perfection when injury is concerned.
DecSuport
Quantitative
Qulitative
Non-Rule Based Symbolic Reasoning
Legal and Ethics
Want to create your own Notes for free with GoConqr? Learn more.