Description
|
|
Created by Maddy Baker
over 6 years ago
|
|
Page 1
Geographers's Toolkit A map represents earth's features drawn on a flat surface Maps use symbols and colours to represent different things Components of a Map Title - What area is shown? What is the topic? Legend - What do the symbols and colours mean? Scale - How much does one cm measure on the ground? Direction - Which way is the map facing? (N, S, E, W) Boarder - What is apart of this map and what isn't? Date of Publication - How new/old is this map? Types of Maps: Large Scale Small area A lot of detail Small Scale Large area Little detail General Purpose Maps Uses symbols and colours to represent different things Can be both small scale or large scale Thematic Maps Reveals geographic patterns Digital Maps On handheld devices Geographic Information Systems (GIS) Provides information about the physical and human world using layers Latitude Imaginary lines that measure the distance north or south of the equator (0 degrees) All lines are 111 km apart Also known as parallels Longitude Imaginary lines that measure the distance east or west of the Prime Meridian (0 degrees) All lines begin or end at the poles (North/South) Also known as meridians Scale Shows the relationship between the distance on the map and the actual distance on the earth's surface
Page 2
The Compass Rose (ALL 22.5 DEGREES APART) N - 0 degrees or 360 degrees NNE - 22.5 degrees NE - 45 degrees ENE - 67.5 degrees E - 90 degrees ESE - 112.5 degrees SE - 135 degrees SSE - 157.5 degrees S - 180 degrees SSW - 202.5 degrees SW - 225 degrees WSW - 247.5 degrees W - 270 degrees WNW - 292.5 degrees NW - 315 degrees NNW - 337.5 degrees
Page 3
Lines of Latitude and Longitude Important Lines of Latitude 90 degrees North = North Pole 66.5 degrees North = Arctic Circle 23.5 degrees North = Tropic of Cancer 0 degrees = The Equator 23.5 degrees South = Tropic of Capricorn 66.5 degrees South = Antarctic Circle 90 degrees South = South Pole Important Lines of Longitude 0 degrees = Prime Meridian 180 degrees = International Dateline
Page 4
Time Zones of Canada Pacific Ocean to Atlantic Ocean Pacific Time Zone - 1 Victoria, British Columbia Whitehorse, Yukon Mountain Time Zone - 2 Edmonton, Alberta Yellowknife, Northwest Territories Central Time Zone - 3 Regina, Saskatchewan Winnipeg, Manitoba Eastern Time Zone - 4 Toronto, Ontario Ottawa, Ontario Quebec City, Quebec Atlantic Time Zone - 5 Fredericton, New Brunswick Halifax, Nova Scotia Charlottetown, Prince Edward Island Iqaluit, Nunavut Newfoundland Time Zone- 5:30 St. John's, Newfoundland
Page 5
Scale Distance used on a map to represent the actual distance between two points on the ground 1 cm on a map can represent any distance on the ground Always use a ruler when measuring distance and be as accurate as possible cm to km = divide by 100 000 km to cm = multiply by 100 000 Linear Scale The scale of the map is indicated by a line with numbers Example: The length of a line is 2 cm; so for this map 2 cm on the map represents 1 km on the ground. Or 1 cm represents 0.5 km on the ground Ratio Scale This scale of the map is indicated by a ratio Example: 1:50 000 1 cm on the ground represents 50 000 cm on the ground But: 100 cm = 1m and 1 000 m = 1km So: 100 000 cm = 1 km To find the length in km represented by 1 cm on the map divide the right hand side of the ratio scale by 100 000 Examples: 1:100 000 = 1 cm represents 1 km 1:500 000 = 1 cm represents 5 km 1:1 000 000 = 1 cm represents 10 km Statement Scale As the name suggests, the scale is stated or written in full sentences Examples: 1 cm represents 0.5 km 1 cm represents 190 km Representative Fraction (RF) This type of scale basically involves converting a ratio scale into a fraction Example: 1:50 000 = 1/50 000 CAUTION Both the top and bottom of a RF scale are expressed in cm Also, the number "1" must always be the numerator of the fraction ANY type of scale can be converted into a Representative Fraction What is the major use for scale? Determining actual distances by using a map It is possible to calculate the actual distance between two points Example: Map distance = 3 cm, which represents "x" km Scale = 1:19 000 000 (1 cm represents 190 km If: 1 cm represents 190 km And: 3 cm represents "x" km . . . then, by cross-multiplying ("x") x (1) = (3) x (190) x = 570 km Therefore, the distance between these points is 570 km There are two ways of measuring distance on a map: "As the Crow Flies" This refers to the straight line distance between two points Using paths or routes You might be asked to measure the distance between two points using a highway, river, pathways, railroad, or other "routes"
Page 6
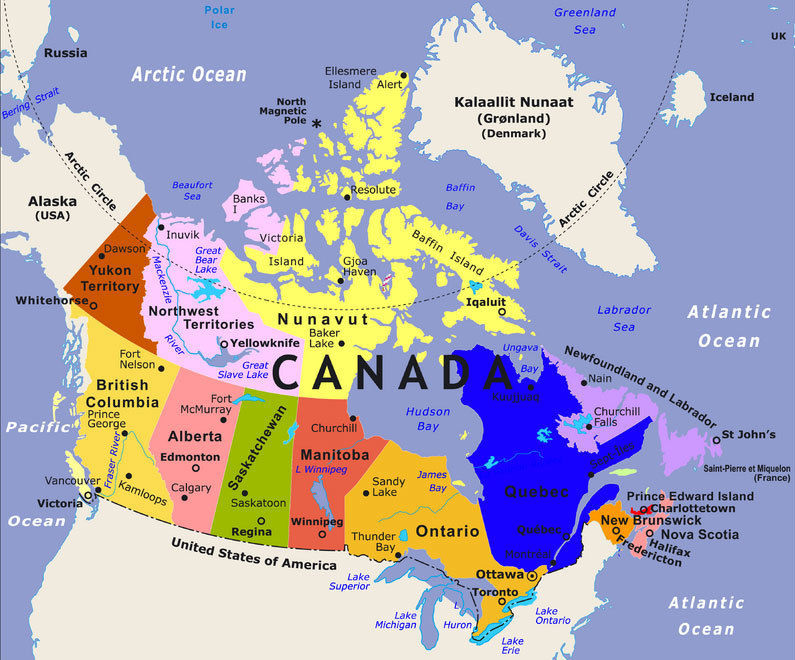
Provinces/Territories & Capital Cities Canada = Ottawa British Columbia = Victoria Alberta = Edmonton Saskatchewan = Regina Manitoba = Winnipeg Ontario = Toronto Quebec = Quebec City New Brunswick = Fredericton Nova Scotia = Halifax Prince Edward Island = Charlottetown Newfoundland and Labrador = St John's Yukon = Whitehorse Northwest Territories = Yellowknife Nunavut = Iqaluit
Page 7
Bodies of Water Great Bear Lake Great Salt Lake Atlantic Ocean Arctic Ocean Pacific Ocean Hudson's Bay Lake Ontario Lake Huron Lake Michigan Lake Erie Lake Superior
Want to create your own Notes for free with GoConqr? Learn more.