Description

|
|
Created by Amardeep Kumar
almost 11 years ago
|
|
Page 1
Module 1 Unit 1: The Economic problem The basic economic problem The basic economic problem is scarcity. The basic cause of this problem is limited resources but unlimited wants. The basic economic problem can be illustrated by every-day global issues, for example: Many people in third-world countries suffer from starvation due to the lack of food, while there are many countries where a lot of food is wasted every year. Many people use their cars on a daily basis, which are expensive to run and damage the environment through pollution, meaning that more money has to spent conserving the environment. Poverty is an example of uneven distribution of wealth, such as in countries like Brazil where the poor live in favelas around the city. A lot of money is funded for medical research which is not always successful. The consequence arising from the basic economic problem is that resources have to be rationed among competing demands. Therefore, control mechanisms are used to allocate scarce resources, but they have their disadvantages. for example: Money - this can be abused or misspent. It also creates inequality, and those with the most determine production Government - if they can decide what resources are needed, they may become corrupt or anti-democratic. Economic resources The purpose of economic activity is to produce goods and services that satisfy human needs and wants. Economic good - this is a product or service that generates a cost in it's production and/or consumption. This means that resources available for its production are limited and must be rationed among those who need or want it. For example: Bottled water - cost generated in production A computer - cost generated in production and consumption Waste - cost generated in production and consumption Free good - this is a product or service that does not generate a cost in its production or consumption. For example: Beaches - naturally occurring land form that is free to use without any restrictions of space The Sun - natural source of light and heat which can be consumed by anybody Air - the air around us is free for us to use and generates no cost in production or consumption as it is natural Factors Of Production Factors of production are economic resources that can be turned be turned into finished goods that will then satisfy a human need or want. Factors of production are classified under 4 main headings: 1. Land - This represents all the natural resources that are obtained from land such as minerals, gases, oil, food etc. Natural resources can then be divided into renewable and non-renewable resources: Renewable resources can be replaced once they are consumed. A non-renewable resource is finite meaning that it cannot be replaced once it has been consumed. 2. Labour - This represents the quality and quantity of the workforce available. The quality is determined by factors such as: -Education-Technology-Motivation-ManagementThe quantity is determined factors such as:-School leaving age-Retirement age-Migration (immigration and emigration)3. Capital - This is any man-made resource that is used in the production of goods and services such as tools, machines, factories, offices, roads etc. There are 2 types of capital: Working capital - this is resources tied up in stock of raw materials, work in progress and finished goods and cash. Therefore the business will want to turn this into something they can sell in order to make a profit. Fixed capital - this is the stock of buildings , factories and machines etc. The business needs these resources in order to turn working capital into goods that can be sold. 4. Enterprise - This represents the ability of individuals and firms to turn factors of production into finished goods that can be sold for a profit. Enterprise takes place in two forms: The ability to combine factors of production in a profitable way. The willingness of an individual to take risks with their own and others money. Economic Agents Economic agents is the term given to individuals, firms and governments who carry out and are affected by economic decisions. The 3 economic agents are: 1. Individuals - their objectives: To make money in order to survive and provide for their family To acquire luxuries to improve standards of living To obtain a degree through a good education to get the best job they can To live a long, healthy and happy life 2. Firms - their objectives: To increase sales and lower production costs to maximise profits To increase growth and market share To gain global recognition and go down in history 3. Government - their objectives: To make sure they make the right decisions To set the right amount of tax which is both fair and economic Control price inflation To ensure stability to reduce the likelihood of a crash
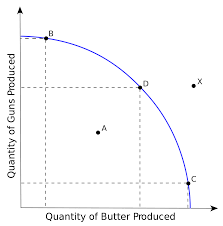
Opportunity cost, the margin, trade-offs and conflicting objectivesThe Production Possibility Frontier (PPF) - This is the name given to the curve used to show all the possible combinations of goods that can be produced from scarce or limited resources using the factors of production, implying all of the resources are fully and efficiently employed.
The PPF is curve shaped to illustrate the opportunity cost of producing an additional unit of an output, indicating that resources are more efficient at producing one good compared with another. Point A - resources are not fully employed or economy is using the resources inefficiently Point B, D and C - economy is productively efficient - all resources are fully employed Point X - unattainable unless economy can increase resources/productivity/efficiency etc. Opportunity cost is the value of the next best alternative. All economic resources have an opportunity cost because there is a cost generated in their production and/or production. Free goods have no opportunity cost.For example, at point B, 50 guns and 10 tubs of butter are produced efficiently. Production moves to point D, so now 30 guns and 30 tubs of butter are produced. The opportunity cost at point BD of producing 20 less guns for 20 more tubs of butter is 1 (lost / gained).
Value judgements, Positive and Normative statementsPositive statements: A positive statement is factual and so can either be proved or disproved.Normative statements: A normative statement reflects a point of view or value judgement, so it cannot be proven true or false.
ProductionThis is the name of the process by which resources (inputs) are turned into goods and services (outputs) that satisfy human wants and needs.Production is classified into 3 economic sectors:1. Primary - this sector involves the production of raw materials such, for example: Farming Fishing Mining 2. Secondary - this sector involves turning raw materials into finished goods, for example: Manufacturing Construction 3. Tertiary - this sector involves any services such as: Finance Healthcare Education Legal Law enforcement Adam Smith, the father of modern economics, explained that production output can be increased by reorganising production:Division of labour - production process is divided up into a number of separate tasks that enables workers to specialise in performing fewer tasks.Specialisation - this means the worker can concentrate on a narrow range of tasks in which they is most efficient. this enables them to develop the skills suitable for these tasks thus improving their productivity.Capital equipment - increased use of capital equipment is more cost effective considering the significant increase in the level of output.The consequence of dividing labour and specialisation is an increase in the level of productivity, as by performing fewer tasks more efficiently, less time is wasted by workers moving between tasks which would otherwise have an opportunity cost. Furthermore, increase in capital equipment overall lowers the cost of production, and overall, more outputs can be produced from a given level of inputs.
Specialisation and exchangeThe weaknesses of a system of barter: Coincidence of wants - it takes time to find an individual with whom an exchange can take place, which has an opportunity cost Indivisibility - items cannot easily be divided up for trade Storing - some items such as grains will need to be stored, and this creates additional cost Measurement - it is difficult to compare the value of one item with another. The key functions of money: Medium of exchange - the currency is universally acceptable Store of wealth - money should retain its value overtime, but it may be affected by inflation/deflation Unit of measurement - all items can be given a relative value Standard of deferred payment - a producer is willing to accept a payment on credit from a customer.
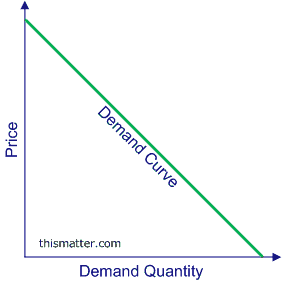
Unit 2 - The allocation of resourcesMarketsA market is a place where buyers and sellers come together to buy and sell (exchange) goods or services. For example, a retail market like Tesco, a second hand market such as eBay or a stock market. A market requires two individuals: A consumer - the buyer who creates demand A producer - the seller who creates supply Demand and priceDemand is the amount of a good or service a consumer is willing and able to buy at a certain time and particular price on the basis of their income.
Price is shown on the y axis, and quantity demanded is on the x axis The relationship between price and quantity demanded is negative or inverse because a rise in price should in theory result in a fall in demand A rise in price should cause a movement up the demand curve A fall in price should cause a movement down the demand curve The demand curve slopes downwards from left to right
Altogether there are 9 key factors that affect demand:1. Consumer Income - Depending on how much the consumer earns can affect the level of demand. The consumer's income may rise due to a pay rise or a new position with a higher level of pay, and so they are able to buy more. Therefore a rise in the income of a consumer should in theory result in an increase in the demand for the goods and services they buy, and the demand curve will shift to the right.However, this is only true for goods considered as normal goods, as they have a positive relationship with income. For example, Adidas trainers, Tesco groceries or a nice holiday to Turkey. On the other hand, Inferior goods have a negative relationship with income - as income rises, the demand for these goods falls, and so the demand curve shifts to the left. This is because they are cheaper than normal goods and are in demand when incomes are lower - for example: Umbro shoes, groceries from Aldi or camping in Cornwall.2. Consumer tastes, fashion and habits - This is all based on the inevitability of changes in consumers tastes, fashion and buying habits. For example an increase in the demand for online movie streaming services such as Netflix will be shown as the demand curve shifting to the right. However, this has caused the demand for DVD's to shift to the left as they become less popular and their demand decreases as people discover online video streaming is easier, cheaper and hassle-free.3. Advertising - Advertising is any method of communication that attempts to raise awareness about a product or service, and in turn increasing its demand. Therefore, advertising shifts the demand curve to the right,, meaning that there is a greater quantity of demand available at each existing price.Advertising takes place in many forms such as television, radio, billboards, newspapers, magazines, internet, posters, flyers, leaflets etc.4. Price of substitutes - The demand for a good is affected by the price of substitutes. A fall in the price of one good will increase it's demand, and as a result cause a fall in the demand for a substitute good. Therefore, the relationship between substitute goods is a positive one - as the price for one falls, the demand for the other falls.5. Price of Complements - A fall in the price of one good will increase it's demand, and therefore the demand for the complementary good should also rise. For example, if the price for PlayStation 4's fell, the demand for the system will shift to the right. As a result, the demand for it's video games and accessories will also increase. The relation between complementary goods is therefore negative - as the price of one good falls, the demand for the other increases.Similarly, if the price of one good rises, the demand for the complementary good decreases. for example, if the price of oil rises, then the demand for air travel will fall, because it's price will also rise. This is also a negative relationship - as the price of one good rises, the demand for the other good falls.6. The availability of credit - credit is where a consumer purchases something but does not have to pay until a later date. For example a credit card or a loan, but essentially they all mean the same thing - and they all come with interest as a reward to the lender: the higher the interest rates, the greater percentage the borrower has to pay. A fall in interest encourages consumers to borrow more money, and use it to purchase more goods and services. Therefore, the use of credit shifts the demand curve to the right.7. Legislation - legislation is the act of government intervention, which causes demand to shift to the left as demand decreases. Acts of legislation include having a minimum age on types of consumption, or limiting the consumption of a good by banning it from certain places.8. The environment - The environment refers to the climate, and can either be good or bad. A hotter climate will increase the demand for goods such as holidays, sun protection, and sunglasses, but decrease the demand for substitute goods such as scarves, hats and gloves. A colder climate will have the same opposite effect on substitute goods.9. Demographic factors - Demographic factors are based on the changing structure of human populations, such as: Population growth The age structure of the population The house structure of the population
Factors that affect supply 1. Changes in a firms costs of production - firms will want to operate at the lowest cost possible. They can do this by improving the quality of their workforce through training, technology, motivation and management to improve the productivity of the workers so they produce more at the same cost. This will also increase the size of the firm, where economies of scale can be exploited, resulting in falling costs. If costs fall, the supply curve will shift to the right causing an increase in the quantity supplied.However, costs may rise for a firm. For instance, workers may demand higher wages, or the business may gain diseconomies of scale as it expands, causing the production costs to rise. As a result, if costs rise the supply curve will shift to the left causing a decrease in the quantity supplied.2. Technology - Technology allows the supplier to produce more goods because it is much more efficient compared to human workers. This is because it is cheaper to run as it doesn't require wages, and it does not need to rest because it does not experience exhaustion like humans do, so the producer can increase production. Therefore, technology shifts the supply curve to the right to illustrate that the firm is able to produce more efficiently and at a lower cost.3. Competition - Competition in the market is determined by the number of firms. New firms can enter the market at any time, while many firms may leave - and both of these affect supply.The consequence of new firms entering the market is that supply shifts to the right, as there are now more firms that are able to supply more at each existing price. The consequence of firms leaving the market is that supply will shift to the left, as there are now less firms that will now supply less at each existing price.4. Supply taxes - An excise tax is added to the price charged to the consumer by the supplier. The money made on excise taxes by the producer is then paid to the government, which as a result increases costs for the supplier. The effect of tax on the supplier is that the supply curve shifts to the left so that less is supplied at each existing price.5. Subsidies - A subsidy is a sum of money paid by the government to a producer to enable them to supply more without them having to raise the price. Therefore, a subsidy will shift the supply curve to the right, as the producer can now supply more at each available price.6. Legislation - government legislation can affect supply in a number of ways. If a firm is forced to change its production methods, it may incur increased production costs and therefore cause a fall in supply. Furthermore, the introduction of a minimum wage will also mean higher costs for a firm. In these cases, the production costs have increased, so supply will shift to the left as producers are willing to supply less at each existing price.However, many markets such as gas, electric and telecommunications have been opened up by the government for new firms to enter. This is called deregulation, and it causes the supply curve to shift to the right as there is an increased number of firms in the market.7. Climate - In terms of supply, the climate plays a very important part, especially in the supply of agricultural produce. Good weather will shift the supply curve to the right, whereas bad weather will shift supply to the left.
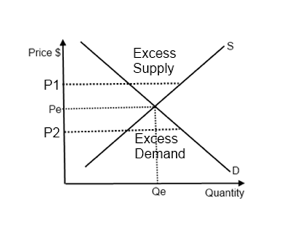
The Market EquilibriumMarket equilibrium is when supply and demand intersect. This determines the equilibrium price p* and quantity q*, which is the price that producers and consumers agree to trade.
Disequilibrium in the market:
P1 = Excess Supply - supply exceeds demand implying there is a surplus in the marketP2 - Excess Demand - demand exceeds supply implying there is a shortage in the market
Restoring equilibrium in the market
Rise in demand e.g. rise in consumer incomes - demand now exceeds supply - market price will rise Rise in supply e.g. subsidies from government - supply now exceeds demand - market price will fall
Price elasticity of demandThis is the measure of the responsiveness of a proportionate change in demand to a proportionate change in price.
Relatively elastic demand
The demand curve is relatively flat in shape A change in price leads to a greater change in quantity demanded The availability of substitutes means that demand is price elastic The longer the time period available to adjust to a rise in price, the greater the elasticity Example of price elastic goods: new cars (substitutes available), drugs (to encourage consumption), Air travel (long time period). The Price Elasticity of Demand > -1 Demand is Perfectly Price Elastic = Infinite A cut in price will increase total revenue An rise in price will decrease total revenue
Relatively inelastic demand
The demand curve is relatively steep in shape A change in price leads to a smaller change in quantity demanded If there are no appropriate substitutes available, demand is price inelastic The shorter the time period available to adjust to a rise in price the greater the price inelasticity of demand Examples of price inelastic goods: petrol (essential, small price range), water (essential) Air travel (short time period) The Price Elasticity of demand Demand is Perfectly Price Inelastic = 0 A rise in prise will increase total revenue A cut in price will decrease total revenue
P.E.D = % Change in Quantity Demanded / % Change in Price.
Price elasticity of supplyThis is the measure of the responsiveness of a proportionate change in price due to a proportionate change in price.
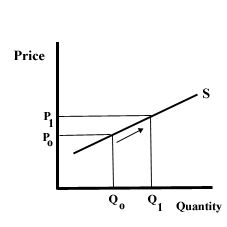
Relatively Elastic Supply
The supply curve is drawn relatively flat A change in price will lead to a proportionally greater change in the quantity supplied Producers therefore find it easier to respond to higher prices by increasing supply The availability of substitutes means that supply is price elastic The longer the time period available to adjust to a rise in price, the greater the elasticity e.g. Cars are supply elastic - producers can switch resources to and from cars to respond to changes in demand for other cars Price Elasticity of Supply > 1 = Elastic
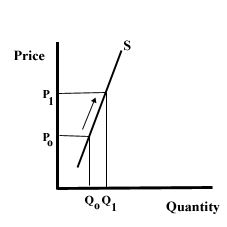
Relatively Inelastic Supply
The supply curve is drawn relatively steep A change in price will lead to a proportionally smaller change in quantity demanded Producers find it more difficult to increase supply in response to a rise in price There are no appropriate substitutes available for goods which are supply inelastic The shorter the time period available to adjust to a rise in price, the greater the inelasticity e.g. farming - a farmer will have to significantly change prices in response to a change in demand - it takes months to grow crops Price Elasticity of Supply
P.E.S = % Change in Quantity Supplied / % Change in Price
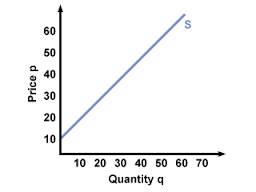
Price is shown on the y axis, and quantity supplied is on the x axis The relationship between price and quantity supplied is positive, meaning that a rise in price should in theory lead to a rise in supply A rise in price causes a movement up the supply curve A fall in price causes a movement down the supply curve The supply curve slopes upwards from left to right Shifts in the supply curve An increase in supply will cause the supply curve to shift to the right (outwards). This means that producers are now willing to supply more at each existing price. A decrease in supply will cause the supply curve to shift to the left (inwards). This means that producers are only willing to supply less at each existing price.
Supply and priceSupply is the quantity that producers are willing to supply at different prices.
Income elasticity of demandThis is the measure of the responsiveness of the proportional change in quantity demanded due to a proportionate change in income.Types of Income elasticity: Normal goods have a positive income elasticity Inferior goods have a negative income elasticity Necessity goods have an income elasticity less than 1 e.g. food, water, housing Luxury goods have an income elasticity greater than 1 e.g. a holiday to Dubai, Armani clothing
I.E.D = % Change in Quantity Demanded / % Change in Income.
Cross elasticity of demandCross elasticity is the measure of a proportionate change in demand fore one good in response to a proportionate change in the price of a related good.There are two types of related goods:1. Substitute goods - the X.E.D. for substitute goods is positive, because they have a positive relationship - a fall in the price of one leads to a fall in the demand for the substitute.2. Complementary goods - the X.E.D for complementary goods is negative, because they have a negative relationship - a fall in the price of one good leads to the rise in demand of the complementary good.
X.E.D = % ^ Quantity Demanded For good X / % ^ Price of Good Y
Want to create your own Notes for free with GoConqr? Learn more.