Description

|
|
Created by Amardeep Kumar
over 10 years ago
|
|
Page 1
Unit 1 - The Economic Cycle
A key objective of Government is to increase the total output of goods and services produced and consumed within the economy because this leads to higher employment and living standards. This output is called the Gross Domestic Product and is calculated by adding up the total output of all producers within the UK Economy. The economy is divided into three sectors:1. The primary sector - this is the sector involved in the production of raw materials, e.g.: Farming - food Fishing - within the Eurozone Mining - coil, oil, shale gas Forestry - Northern Europe This is all mostly imported 2. The secondary sector - includes suppliers who turn raw materials into finished goods. This sector includes: 1) Manufacturing Cars - Toyota, Jaguar-Land Rover, Honda, VW, Ford, Nissan... Defence Aeroplanes - Rolls Royce, Airbus High tech goods - Toshiba, Panasonic 2) Construction3. The tertiary sector - includes suppliers who provide any type of service:Education, Healthcare, Financial, Legal, Law enforcement, Armed forces, Retail & wholesale, Tourism, Media and Personal.
The Growth of the UK Economy: Economic growth is the increase in the productive capacity of the UK economy and this is measured by the change in real GDP.
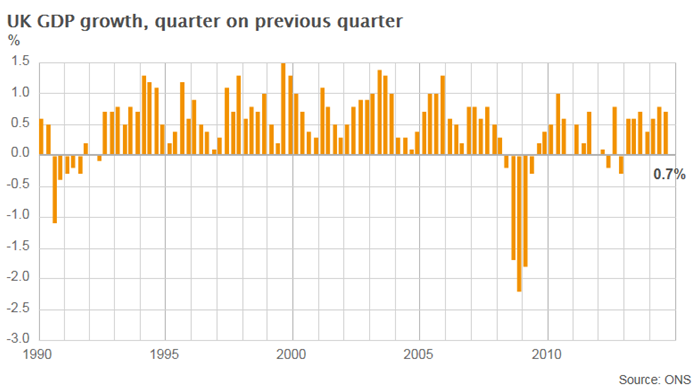
GDP is the monetary value of the total output produced in each sector. This is measured both quarterly and annually. The measure is adjusted for inflation to calculate whether output has risen or fallen. The percentage changes in GDP between one quarter and the next is the indicator used to measure economic growth. Economic growth is positive when the value of GDP growth is above 0 and this implies the output of the economy has increased over the quarterly period. Economic growth is negative when the value of GDP growth is below 0 and this implies the output the economy has decreased over the quarterly period. An economic recession occurs when GDP growth is negative for two consecutive quarters or a period of six months.
Key dates of the two recessions 1990 - Q3 - The economic recession of 1990/91 lasting 5 quarters, where the economy contracted by a total of -2.3%. 2008 - Q2 - The economic recession of 2008/09 lasting 5 quarters, where the economy contracted by a total of -6.2%. The recession of 2008/09 lasted the same time, but the economy contracted deeper by -3.9%.
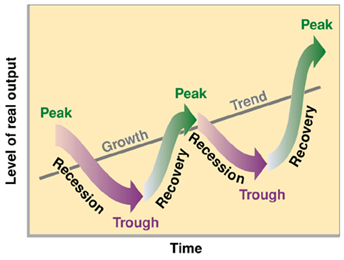
The Economic Cycle: The economy therefore does not grow at a constant rate every quarter but fluctuates and is characterised by phases of -Growth -Recession -Boom -Slump -Upturns -Downturns
-Economic growth is a phase of the economic cycle when the productive capacity is growing and GDP growth is positive.-An economic recession is phase of the economic cycle when economic growth is negative for two consecutive quarters and means the productive capacity of the economy is shrinking.-A boom is a phase of the economic cycle when economic growth is growing above its trend rate of growth which for the UK has been calculated at about 2.25%-2.5%. This means output is above a level that the economy can be sustained over the long term.-A slump or depression is a prolonged recession where GDP shrinks by more than 10%. The last slump experienced by the UK was in the 1930’s which lasted from all of this decade and only came to an end as a result of World War 2. The Wall Street Crash was a signal that the global economy was entering a severe downturn. Some are worried that the recent financial crash may signal a slump of similar proportions.-An upturn means economic growth is accelerating and productive capacity (output) is growing at an increasing rate. A rise from 0.5% to 1.5% quarterly growth is an example.-A downturn means economic growth is slowing down and output is growing at a decreasing rate. A fall in growth from 2.4% to 1.1% is an example. The economy is still growing but at a slower rate. -A double dip recession means that two periods of negative growth have occurred one after the other without the economy returning to its trend rate of growth for a sustained period in between.
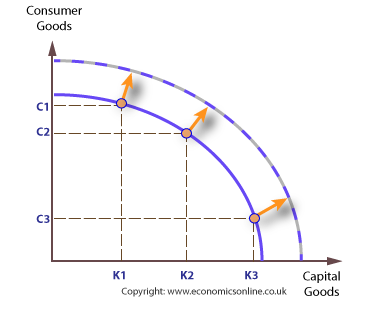
How Economic growth affects output Output can be classified into: a) Consumer goods food, clothing and shelter that satisfy human demand b) Capital goods such buildings and machines that produce consumer goods. Economic growth can be illustrated using a production possibility frontier.
The production possibility frontier is curved to illustrate how there is a limit to the productive capacity of the economy. Economic growth is illustrated by an outward shift of the PPF Economic recession is illustrated by an inward shift of the PPF Investment in capital goods is the key to generating economic growth. Consumer goods are favoured in production to capital goods (C1,K1). Economic growth implies a rise in output, employment and living standards.
The benefits of economic growthEconomic growth is desirable because it generates benefits for consumers, producers and society: Economic growth means the productive capacity of the economy has risen. 1. This means a higher level of output of good and services. This can be illustrated by an increase in the production possibility frontier. 2. This means that the supply of capital good has risen and this will result in more consumer goods being available. 3. This will create more jobs in the economy leading to higher wages, salaries and consequently living standards. 4. Technological improvement will result in better quality goods at cheaper prices. 5. Consumers will have more disposable income to spend on consumer durables such as property and services. 6. Higher tax revenues for the state will allow higher spending on merit goods such as health and education. 7. Growth encourages further increases in enterprise and investment. 8. Firms benefit from higher profits which can be used to finance new investment. Therefore economic growth leads to higher levels of output, employment, wages, profits and living standards. Government benefits from higher tax revenues leading to better public services such as health and education.
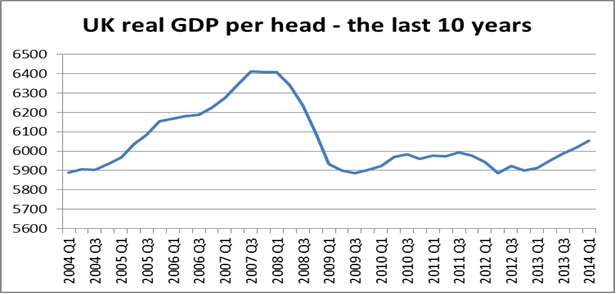
GDP per Capita GDP per capita is calculated by dividing GDP by population, and is a more accurate measure of the increase in living standards because it provides a crude monetary measure of how resources are divided amongst the population of that country.
GDP per capita is calculated as: GDP / Population. In theory, a rise in economic growth would mean a rise in GDP, and therefore a rise in GDP per capita. However, since 2008 GDP per capita has not seen a significant increase despite a growth in the economy. This is due to the significant population growth was has grown quicker than Real GDP. Factors contributing to population are immigration, a rise in the birth rate and a fall in the death rate.
Economic Growth and the Price Level Economic growth measures changes in real GDP and therefore the effects of inflation have been removed. This means economic growth measures the change in actual output. Inflation is a measure of the average rise in prices. It is calculated by comparing the price of a basket of goods and services over a period of time. The basket includes a selection of goods and services that the typical family buy on a regular basis. In the UK, an index called the consumer price index (CPI) is used to measure changes in the average price level. Value of total output - % Change in GDP - % Change in InflationE.g. In 2010 GDP was £100bn, and in 2011 it was £110bn. The rise in GDP in money terms = 10% Inflation during this period was was 6% Total economic growth = 10% - 6% = 4% GDP. Therefore, the value for real GDP or economic growth will have been adjusted for the increase in prices that will have taken place during this period.
The use of Index Numbers to express data:
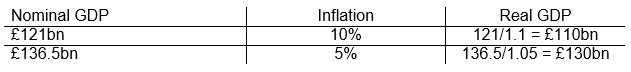
Nominal - GDP NOT adjusted for inflation, and is valued using current prices for that period.Constant - GDP adjusted for inflation, and so must be expressed according to a base year.
2004: Nominal GDP - £121bn ~ Inflation index - 10% ~ Real GDP - 121/1.1 = £110bn. 2005: Nominal GDP - £136.5bn ~ Inflation index - 5% ~ Real GDP - 136.5/1.05 = £130bn. Hence, Real GDP = Nominal GDP / Infation Index (as a decimal.) GDP Growth = Growth / Base Real GDP x 100%. GDP Growth = £20bn / £110bn x 100% = 18%.
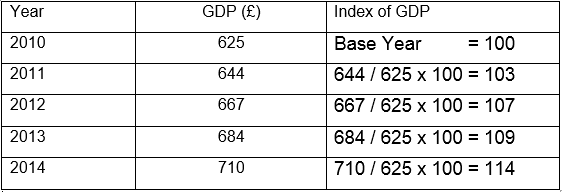
To calculate index: 1. Select a base year e.g. 2010 (£625bn). 2. Use the formula for each year: Current GDP / Base GDP x 100 E.g. 2012 - 667 / 625 x 100 = 107%. 3. Precentage of annual growth = % Change / Previous Index x 100 E.g. 2012 - 4 / 103 x 100 = 3.9%.
The Circular Flow of Income Macroeconomics is concerned with the economy as a whole and therefore focuses on output, employment, inflation and trade. National output is considered the key indicator to the health of the economy. A healthy economy is one when the national output is growing while an unhealthy economy is one when national output is contracting.
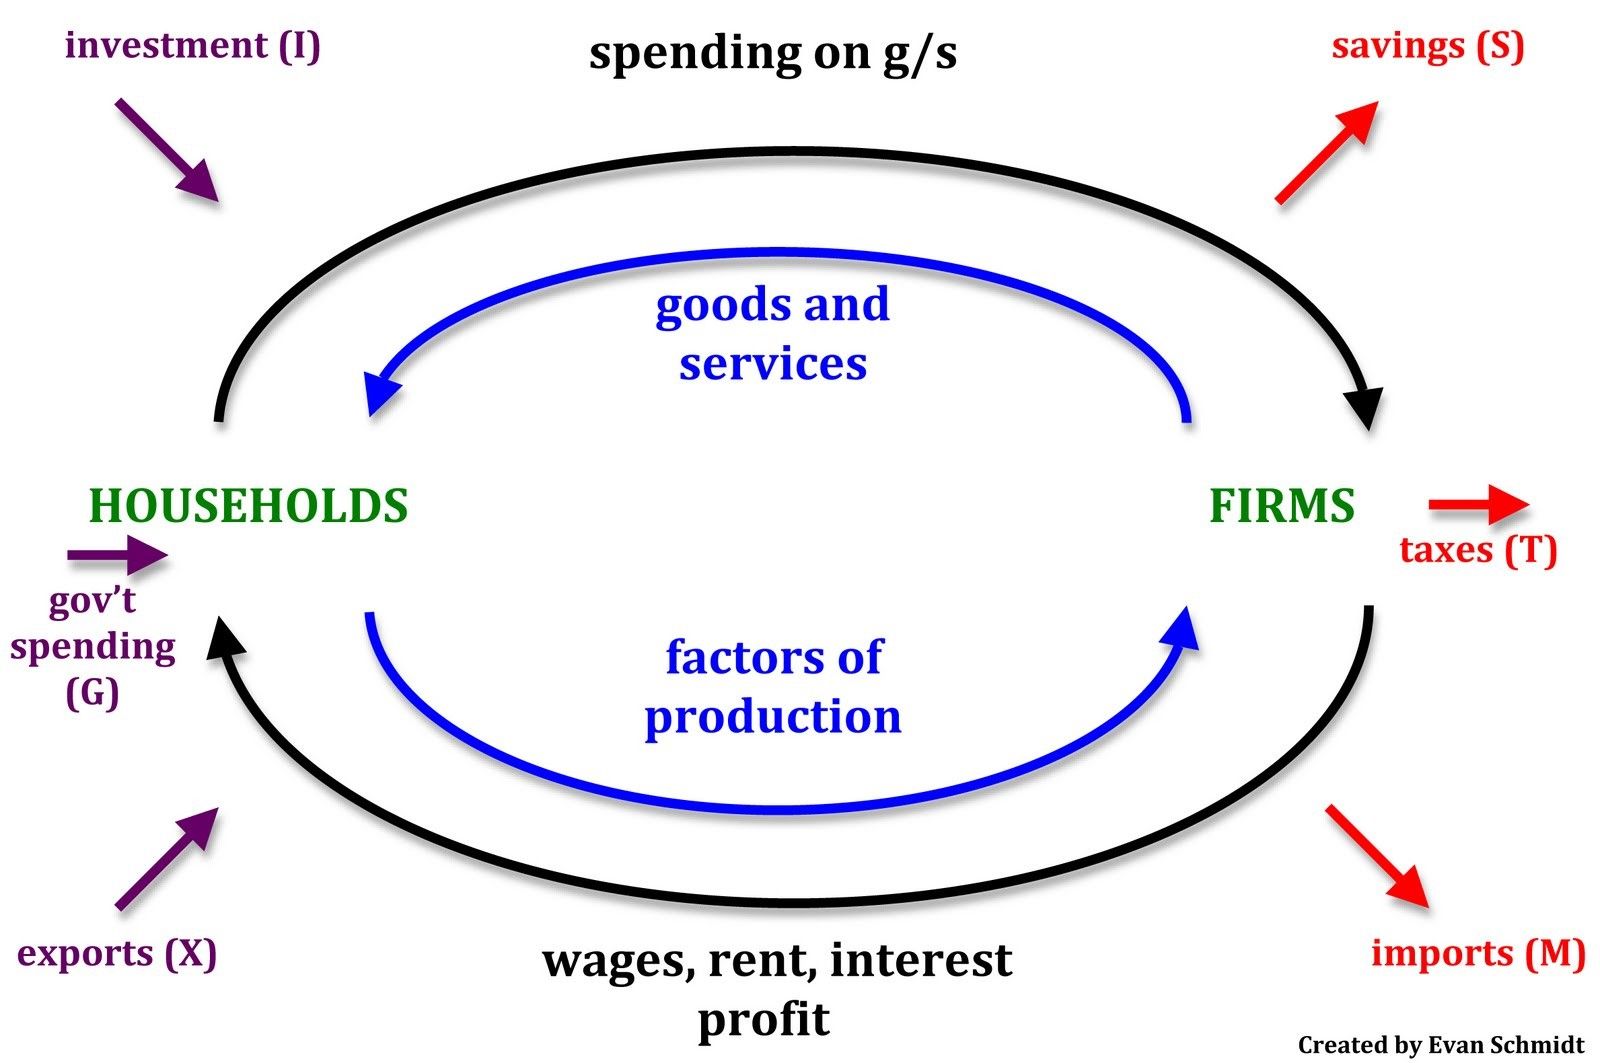
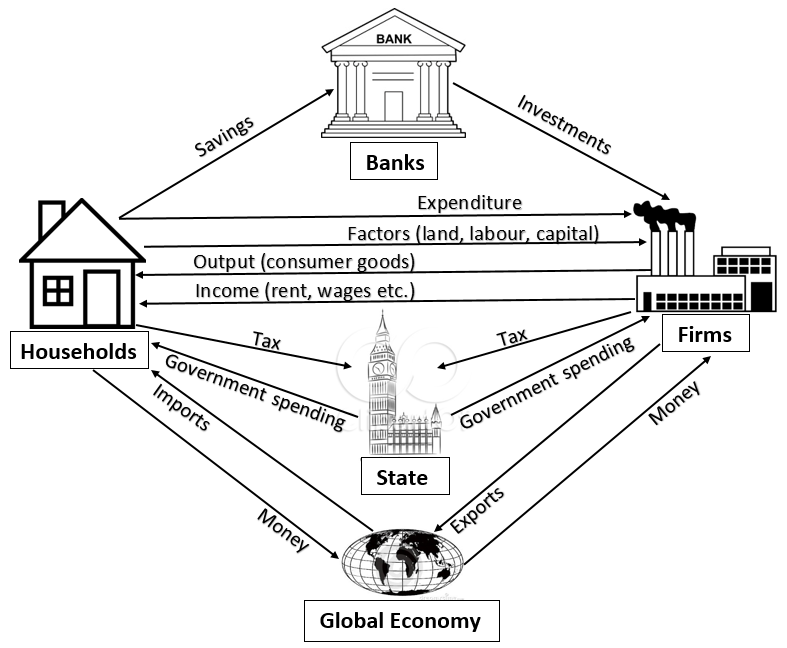
1. Households own the factors of production such as land, labour and capital which they supply to firms in return for an income in the form of wages, rents and dividends. 2. Firms produce all the goods and services by hiring or renting factors of production from households. 3. Households used their income to buy finished goods and services from firms. 4. This produces three flows that can be measured: a) The output of goods and services from firms. b) The income of household. c) The expenditure by households on goods and services. Income = Expenditure = Output It is assumed in this simple model that all income is spent on buying goods and services.
Injections and Withdrawals
Injections are sources of income that cause the economy to grow such a: 1. Investment spending by firms on capital goods such as Factories and warehouses Equipment and machinery Buildings and offices. 2. Government spending onEducation, healthcare, defence, welfare, defence, public order, housing and infastructure. 3. Exports which are goods produced in the UK but sold abroad and therefore bring in income such as Food and drinks Alcohol and tobacco Cars and aeroplanes Drugs and medicine Oil.
Withdrawals cause the economy to contract such as: 1. Savings is the part of disposable consumer income that households choose not to spend, but is invest inBanks, shares, pensions and bonds. 2. Tax is that part of gross household income that the government takes and can be in the form of Excise tax (alcohol and tobacco) Value Added Tax (VAT) National insurance Council tax, road tax and income tax Corporation tax. 3. Imports are that part of household income that is spent on goods produced outside the UK and therefore is not received by UK firms. Almost every item The UK exports can also be imported.
Measuring income, expenditure and output The value of national income and output is measured in three simple ways: 1. The Office of National Statistics calculates the value of quarterly GDP in the following way Information on sales is collected from 6,000 companies in manufacturing, 25,000 service sector firms, 5,000 retailers and 10,000 companies in the construction sector. Data is also collected from government departments covering activities such as agriculture, energy, health and education. This is augmented by a wide range of sources which ensure that activity in the economy is well covered. This method is considered the most accurate in the short term. 2. The department of Revenue and Customs is able to provide a measure of national income from information calculated on tax receipts such as income tax and VAT. However, this measure would not be able to provide a quarterly calculation of GDP because the self employed and firms pay their tax annually.
Want to create your own Notes for free with GoConqr? Learn more.