Description
|
|
Created by Andrea Leyden
almost 12 years ago
|
|
Page 1
There are three main types of average: mean - The mean is what most people mean when they say 'average'. It is found by adding up all of the numbers you have to find the mean of, and dividing by the number of numbers. So the mean of 3, 5, 7, 3 and 5 is 23/5 = 4.6 . mode - The mode is the number in a set of numbers which occurs the most. So the modal value of 5, 6, 3, 4, 5, 2, 5 and 3 is 5, because there are more 5s than any other number. median - The median of a group of numbers is the number in the middle, when the numbers are in order of magnitude. For example, if the set of numbers is 4, 1, 6, 2, 6, 7, 8, the median is 6
This video shows you how to calculate the mean, median and mode:
This video shows a very catchy song to help you remember the difference between these 3 terms:
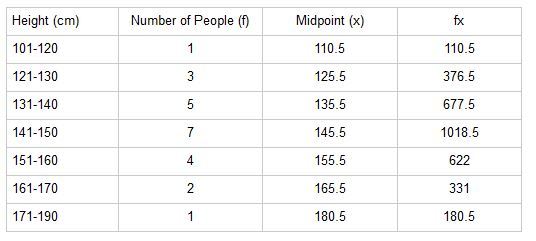
When you are given data which has been grouped, you can't work out the mean exactly because you don't know what the values are exactly (you just know that they are between certain values). However, we calculate an estimate of the mean with the formula: ∑fx / ∑f , where f is the frequency and x is the midpoint of the group (∑ means 'the sum of'). Example Work out an estimate for the mean height, when the heights of 23 people are given by the first two columns of this table:
A moving average is used to compare a set of figures over time. For example, suppose you have measured the weight of a child over an eight year period and have the following figures (in kg): 32, 33 ,35, 38, 43, 53, 63 ,65 Taking the mean doesn't give us much useful information. However, we could take the average of each 3 year period. These are the 3-year moving averages. The first is: (32 + 33 + 35)/3 = 33.3 The second is: (33 + 35 + 38)/3 = 35.3 The third is: (35 + 38 + 43)/3 = 38.7, and so on (there are 3 more!). To calculate the 4 year moving averages, you'd do 4 years at a time instead, and so on...
Mode The mode is the number in a set of numbers which occurs the most. So the modal value of 5, 6, 3, 4, 5, 2, 5 and 3 is 5, because there are more 5s than any other number. Range The range is the largest number in a set minus the smallest number. So the range of 5, 7, 9 and 14 is (14 - 5) = 9. The range gives you an idea of how spread out the data is. The Median Value The median of a group of numbers is the number in the middle, when the numbers are in order of magnitude. For example, if the set of numbers is 4, 1, 6, 2, 6, 7, 8, the median is 6: 1, 2, 4, 6, 6, 7, 8 (6 is the middle value when the numbers are in order) If you have n numbers in a group, the median is the (n + 1)/2 th value. For example, there are 7 numbers in the example above, so replace n by 7 and the median is the (7 + 1)/2 th value = 4th value. The 4th value is 6.
Height (cm) Number of People (f) Midpoint (x) fx 101-120 1 110.5 110.5 121-130 3 125.5 376.5 131-140 5 135.5 677.5 141-150 7 145.5 1018.5 151-160 4 155.5 622 161-170 2 165.5 331 171-190 1 180.5 180.5 In this example, the data is grouped. You couldn't find the mean the "normal way" (by adding up the numbers and dividing by the number of numbers) because you don't know what the values are. You know that three people have heights between 121 and 130cm, for example, but you don't know what the heights are exactly. So we estimate the mean, using "∑fx / ∑f". A good way of setting out your answer would be to add two columns to the table, as I have. "Midpoint" means the midpoint of each of the groups. So the first entry is the middle of the group 101-120 = 110.5 . Now, ∑fx (add up all of the values in the last column) = 3316.5 ∑f = 23 So an estimate of the mean is 3316.5/23 = 144cm (3s.f.) This short video shows you how to find the mean, mode and median from a frequency table for both discrete and grouped data.
Mean
Grouped Data
Moving Averages
Mode, Range, The Median Value
Want to create your own Notes for free with GoConqr? Learn more.