
Flashcards
PUB560 STats Module 4
Flashcards do conjunto (57)
- 1When can you use Correlation & Regression Denoted by r if estimated from a sample-To use correlation or regression you need the data for both variables to be continuous
- Helpful hint: if the data can be meaningfully portrayed on a scatter plot you can use correlation - 2PEARSON’S CORRELATION COEFFICIENTCan only detect linear associations between 2 variables + Monotonic
Takes values between -1 and +1 inclusive
Values of r close to -1 or +1 indicate a strong linear association
Values of r close to 0 indicate little linear association - 3MonotonicAll correlation coefficients require the association to be monotonic
Monotonic = always increasing OR always decreasing (doesn’t have to be @ the same rate) - 4Cause + Effect Does Evidence of correlation = cause + effect relo?Evidence of a correlation does not (necessarily) mean that a cause and effect relationship exists
Just bc there is an association between 2 variables does not mean 1 variable causes a change in another
There may be an unobserved variable that can be the hidden cause - 5Correlation Vs. Regression-Correlation measures the magnitude of the association between 2 variables
-Regression measures the magnitude of independence of one variable upon another
-Correlation + regression are complimentary techniques - 6Idea of Linear Regression- Want to find the relationship between the independent and dependent variables
- Both variables are continuous so you can plot as a scatter plot
- Want to determine the straight line that best ‘fits’ the data - 7REGRESSION ANALYSIS to perform reg analysis you need... Reg analysis allows you to have....- TO perform regression analysis you need to decide which is the dependent variable (Y) and which is the independent variable (X)
- allows you to have more than one independent variable - 8Main Steps in LINEAR REGRESSION ANALYSIS1. Estimate the regression eqn/‘model’
2.Assess the model + test hypothesis regarding whether x explains y
o Model significance
o Explanatory power (R2)
o Model validity (assumptions)
3.If model “good”, predict dependent V from values of the independent V (optional) - 9Simple Linear Regression EqnYi = Bo + B1Xi + e
B0= Intercept
B1 = regression coefficient (slope of line)
e= error - 10Regression Assumptions1. The dependent V (Y) and independent V (X) are linearly related (scatter plot)
2. The values of Y are independent from each other
(Are they from different people?)
3.The random part of Y (the residual or error) is normally distributed around zero with constant variance - 11What are residuals?The residual is the difference between what our model predicts at a given value of x (y hat – the value on the line) & what we observe (the data yi)
- 12Residual Analysis Assumptions1. Residuals (€) are normally distributed
2. Residuals have a mean of zero
3. Residuals have a constant variance => called homoscedasticity - 13We want to do residual analysis but variances are not equal?a. Transform your data
Log transformation of Y vrble is common
[Ynew = log(Yi)]
b. Use different methods that can deal with heteroscedasticity (e.g. weighted least squares regression) - 14Interpolation:Predicting X and Y values within data range
EXAMPLE: sample ages ranged from 30 to 95 years
Predicting SBP for ages 30 to 95 is interpolation - 15Extrapolation:when you predict Y values for X values beyond those in the sample data
EXAMPLE: sample ages ranged from 30 to 95 years
Predict SBP for 5yr old child
*Dangerous to extrapolate beyond data - 16Simple linear regression (SLR)= one dependent variable (outcome) and one independent variable
- 17Multiple linear regression (MLR)= one dependent variable (outcome) and 2 or more independent variables
- 18MLR MAIN STEPS FOR REGRESSION ANALYSIS1. Estimate regression eqn/model
2. Assess model + test hypothesis
- ANOVA F test
- Model validity
- Explanatory Power
- Parsimony
3. Test hypotheses regarding individul Xs
4. If model 'good', predict dependent V for values of independent V - 19Why the adjusted-R2???- Takes into account # of explanatory variables in the model
- In MLR we have a # of independent variables to explain Y we need to account for
- Non-adjusted R2 ↑ biased with ↑ number of Xs (ie over-estimates the amount of variation in Y explained by Xs - 20PARSIMONYWhen building MLR models we should consider parsimony
Parsimony: the principle of explaining the most variation with the least number of variables
Choosing the simplest model - 21INFORMATION CRITERIAIC = Lack of fit (model) + penalty (num. of parameters)
Good model will have a low lack of fit, and a small number of independent variables Smaller values of IC = ‘better’ model
Can be used for any type of model - 22MulticollinearityOccurs when independent variables are not independent (i.e. they are correlated with each other)
Multicollinearity leads to unstable Bs with inflated confidence intervals
Can be the physical manifestation of confounding in statistical modelling - 23HOW DO WE IDENTIFY MULTICOLLINEARITY?Look @ the P values in correlation matrix (of independent variables) as a prelim guide
Simplest tool is Variance Inflation Factor (VIF) - indicates an increase in B variances due to presence of other collinear variables in model
Rule: VIF <5 is OK
- Collinearity diagnostics is an option in R commander regression Analysis - 24CONFOUDNING DEF IN CONTEXT OF REGRESSIONis a variable that changes the effect (eg slope) of an explanatory variable when the confounder is added to the model
- 25What is Powero The probability of declaring an effect statistically significant when it is true
Larger sample size = larger power
Power = probability of type 2 error (AKA “beta level”, B)
Usual value = 0.8 or 0.9
(type 2 error = 0.2 or 0.1) - 26Ethical Principles in Sample Sizessample size calculation to justify the study size is capable of answering the Q
is required by most funding agencies
too large or too small =wasted resources and, in clinical trials, unethical issues
e.g. more pt's given placebo for nothing - 27Type 1 ErrorFalse +ve
No true difference exists but observed difference is "statistically significant" - 28Type 2 ErrorFalse negative
True difference exists but no "statistically significant" difference observed - 293 Key Numbers For Calc Sample SizePower (80%,90%)
Significance Level (5%)
Effect Size (expected standardized difference) - 30Power vs. Sample Size-For smaller differences, more information needs to be known about the groups and therefore big sample sizes.
Big differences require a smaller sample size.
AKA Sample sizes ↑ as effect ↓ - 31Do 1 sided or 2 Sided/tailed Hypothesis have more power?1 Tailed/Sided
- 32AGREEMENT FOR CATEGORICAL DATA- Can’t use plots for categorical data
- Use cross-tabulation + statistics instead
- E.g. Do a pt’s lab results (positive/negative) agree with their doctor’s diagnosis? - 33Negative predicted valueproportion of test negatives that are the true negatives (if a parent said “no” then 25/30 = 0.83 or 83% were true no’s).
- 34Positive predictive valueproportion of test positives that are true positives (if a parent said “yes” then 55/70 = 0.79 or 79% were true yes’s).
- 35Specificityproportion of true negatives correctly classified (25/40 = 0.63 or 63% of health records not recording immunisation were correctly classified as “no” by the parents)
- 36Sensitivityproportion of true positives correctly classified
E.g. (55/60 = 0.92 or 92% of health records recording immunisation were correctly classified as “yes” by the parents) - 37SIMILAR QUESTIONS (RELIABILITY) (also called internal consistency)- Questionnaires often use similar Qs
- Want to know if questions are being answered reliably (internal consistency)
- one question might be positively phrased and the other negatively - 38Cronbach’s Alpha (a)Measures Reliability
Ranges between 0 (no agreement) to 1 (perfect agreement)
If the reliability questions are too similar then you are wasting resources - 39Correlation Coefficient of 0 =no association
- 40Correlation Coefficient of -1 or +1 =perfect correlation
- 41correlation coefficient negative value e.g. -0.7As one variable increases, the other decreases
e.g. the more someone works out the less they weigh - 42correlation coefficient positive value e.g. +0.7Both variables increase or decrease together
e.g. the higher the amount of daily salt intake the higher a person's BP - 43Correlation 0 to 0.3weak
- 44correlation 0.3 to 0.6Moderate
- 45correlation 0.6+Strong
- 46Correlation coefficient confidence upper and lower analysisare they both in strong range? Is it moderate to strong?
- 47When to do Spearman Correlation Test?nonlinear/ non montonic relo
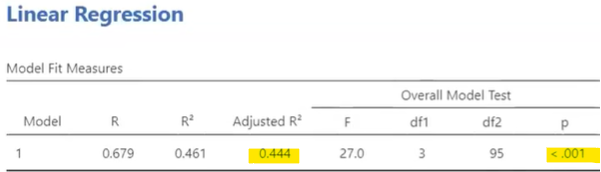
- 48—Adjusted R2 = 0.444 which means 44.4% of the variability is explained by our model (MLR)
P= <0.001 = statistically significant - 49—Age = 0.71 increase in SBP per 1 year increase in age AFTER allowing for BMI and cholesterol. P<.001 = stat significant. Lower and upper CI are above 0
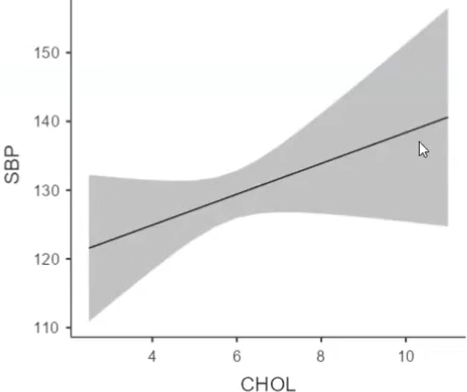
Cholesterol lower CI not above 0 and therefore 0 slope is a possibility. P=0.143 = not statistically significant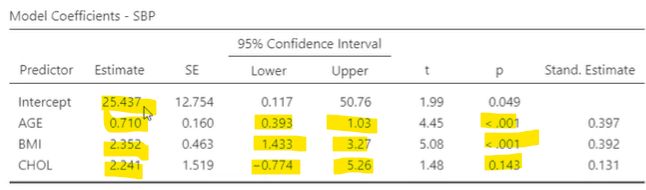
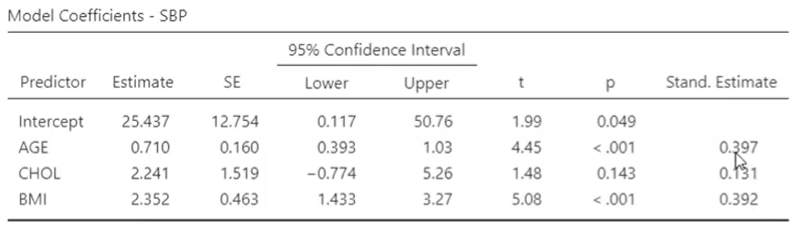
- 50Which has greatest impact?Think about scale. 1 unit change in BMI is greater than 1 unit change of age. Look at standard estimate: age and BMI have the same impact on slope
- 51—why is cholesterol no longer significant when it was previously in univariate analysis etc?
Because when considered WITH BMI and age it no longer is. Means Cholesterol is probably correlated to BMI or age - 52relo or no relo?Relationship bc no horizontal line can fit through the values
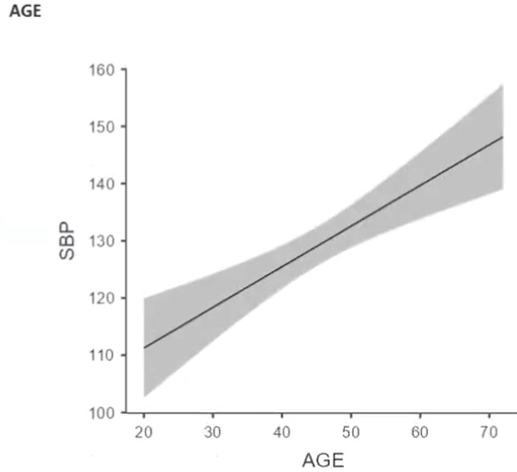
- 53—No relationship bc horizontal line can fit through possbile values
- 54Is collinearity an issue?Collinearity isn't an issue - all VIFs <5
Other measure is Pearson's R which needs to be under 0.9 in correlation matrix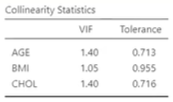
- 553 Hypotheses needed for correlation coefficient SLRH0= all of the regression coefficients = 0
h1 = at least one of the regression coefficients is not equal to zero
h0: b0 = 0 h1: b0dont = 0
h0: b1 = 0 h1: b1dont = 0
slope estimate is most important = basically there is/nt an assoc. - 56variances equal?amount of variance at lower end is the same as the upper end
Predicting just as well for older age groups as you do for younger age groups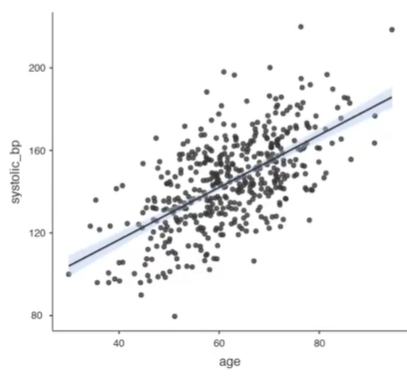
- 57What does having a mean of 0 for residuals mean? What does it mean if they aren't equal?Errors above the line cancel out the residuals below the line
(difference/value wise)
This means the line has been drawn through the middle of the points. If its more to one side then the line is biased.
Informações
- Descrição
- FlashCards sobre PUB560 STats Module 4, criado por Annika Muller em 26-09-2023.
- Criado por
- Annika Muller
- Visualizações
- 0
- Avaliação