
Flashcards
Sem título
Flashcards do conjunto (14)
- 1ONE-TAILED & TWO-TAILED TEST:> 1 TAILED TEST= directional hypothesis e.g. There will be a significant inc/Dec.
> 2 TAILED TEST= non-directional hyp e.g. There'll be a significant diff. - 2WHAT ARE P VALUES AND EX OF P VALUE?> Refers to probability that findings occurred due to chance.
> Tells us if diff between 2 conditions= due to chance/manipulation of IV.
> Written as percentages/decimals.
E.G. P≤0.10= 10% or less than 10% chance of findings occurring due to chance and 90% or less than 90% chance of findings occurring due to manipulation of IV. - 3WHAT IS THE SIGNIFICANT LEVEL OF P VALUES THAT PSYCHOLOGISTS USE?> Significant level (p-value) used by psychologists: 5% or less than 5% (P≤0.05).
- 4WHAT DOES A LOWER P-VALUE SHOW?> Higher rate= findings due to manipulation of IV and low rate= occurred due to chance.
- 5WHAT DOES A HIGHER P-VALUE SHOW?> Lower rate= findings due to manipulation of IV & High rate= occurred due to chance.
- 6WHAT IS THE ROLE OF INFERENTIAL STATISTICS?> Tells you whether diff between 2 conditions= enough for it to be significant enough due to manipulation of IV.
- 7WHAT ARE DESCRIPTIVE STATISTICS?> Gives you 2 key figs for it to be compared from 2 conditions.
- 8AN EXAMPLE OF A TYPE OF INFERENTIAL STATISTIC:> Sign test.
- 9CONDITIONS REQUIRED FOR A SIGN TEST:> Test of DIFFERENCE between conditions.
> RELATED DATA= Repeated measures/ matched pairs design.
NOMINAL DATA= data which is/ can be converted into categories. - 10HOW TO DO A SIGN TEST?1) State the hypothesis.
2) Collect & Record data.
3) Work out diff between scores.
4) Work out sign
5) Work out calculated value for S (smallest no. Of +'s and -'s).
6) Find critical value of S from calf value.
7) Find critical value of S from critical values table.
8) Report conc & state which hypothesis to accept. - 11WRITING A CONCLUSION STATEMENT:> Since calf value of S (_) is less/more than critical value of S (_), the results are/are not significant for N=___ and p≤0.05.
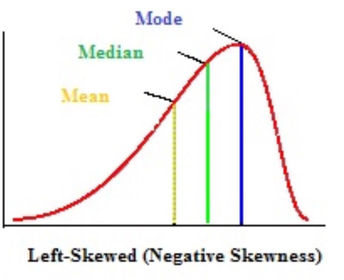
- 12WHAT WILL A NORMAL DISTRIBUTION CURVE LOOK KIKE FOR AN EXAM THAT WAS VERY EASY?Enter text here...
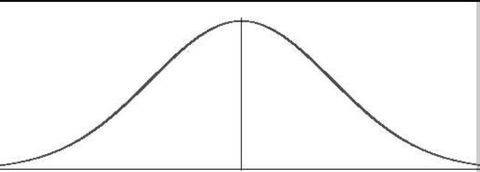
- 13WHAT WILL A NORMAL DISTRIBUTION CURVE LOOK LIKE FOR AN EXAM THAT WAS THE RIGHT LEVEL OF DIFFICULTY?Enter text here...
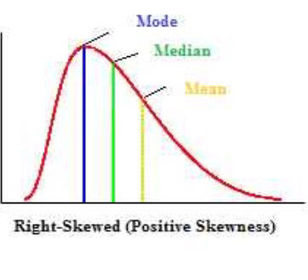
- 14WHAT WILL A NORMAL DISTRIBUTION CURVE LOOK LIKE FOR AN EXAM THAT WAS VERY DIFFICULT?Enter text here...
Informações
- Descrição
- FlashCards sobre Sem título, criado por Tasnim Quddus em 07-03-2017.
- Criado por
- Tasnim Quddus
- Visualizações
- 0
- Avaliação