
Flashcards
EDA Hypothesis Testing
Flashcards do conjunto (26)
- 1What is hypothesis testing?We cannot prove a hypothesis (e.g. the existence of a given relationship), but we can reject one (e.g. reject the existence of a given relationship)
- 2What are the two hypotheses used?First, the hypothesis to be tested is stated
Null hypothesis: The outcome that the researcher doesn't expect
(H0: β ≤ 0 )
Alternative hypothesis: The outcome the researcher does expect
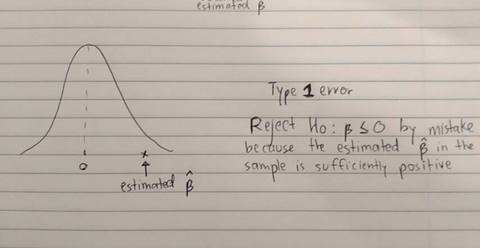
(HA: β > 0) - 3What is a type 1 error?Rejecting a true null hypothesis
(H0: β ≤ 0 is rejected despite being true)
Even if the true β is not positive, a sample might contain an estimate of β that is sufficiently positive, causing us to wrongly reject H0 - 4What is a Type 1 error? (Draw)
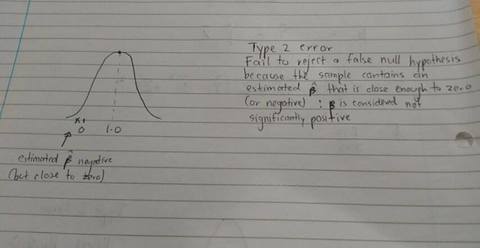
- 5What is a type 2 error?Failing to reject a false null hypothesis
(H0: β ≤ 0 is not rejected, despite being false)
Even if the true β is positive, the sample might contain an estimate that is close enough to zero (or negative). This makes β 'not significantly positive' - 6What is a type 2 error? (Draw)
- 7How can we determine when H0: β ≤ 0 can be rejected?Calculate a sample statistic, and compare this to a pre-selected critical value (from a statistics table)
This is called the "decision rule" - 8What do the range of possible values for the sample statistic represent?They are divided into two regions
1. Region of non-rejection (of the null)
2. Region of rejection (of the null)
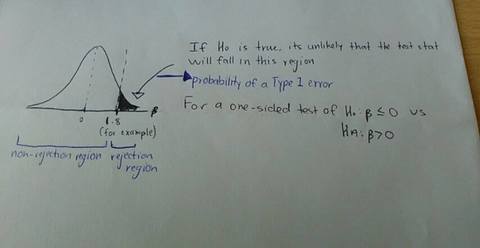
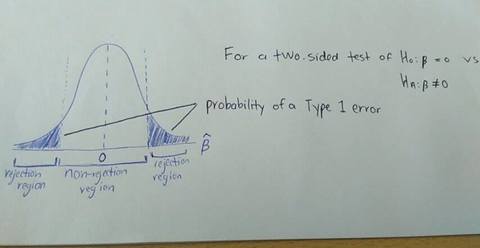
The critical value separates these regions - 9Define the rejection region1. Range of values of the test stat that leads to rejection of the null hypothesis
2. Contains values that are unlikely and have low chance of occurring if the null hypothesis is true
3. "If the test stat falls in a region of low probability, then its unlikely the test stat has the assumed distribution, and unlikely that H0 is true" - 10Draw the rejection region for a one-sided test of β (**can also be a negative region?)
- 11Draw the rejection regions for a two-sided test of β
- 12What is the t-test?It is the test used for testing hypotheses about individual regression slope coefficients
Appropriate when the error term is normally distributed and the variance of the distribution must be estimated - 13The t-test formula?
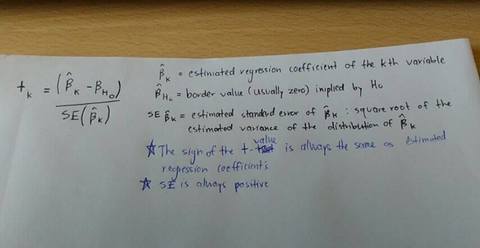
- 14How to find the critical t-value for the t-Test decision rule?Its selected from a t-table depending on
1) Whether its a one or two sided test
2) The level of Type 1 error specified
3) The degrees of freedom (the number of observations minus the number of coefficients estimated [including the constant] or N – K – 1) - 15What is the decision rule for this test?Reject H0 if |tk| > tc and if tk also has the sign implied by HA
Do not reject H0 otherwise
tk= calculated t-value
tc= critical t-value from the table - 16Write out the specific rule for one-sided hypothesesH0: βk ≤ 0 H0: βk ≤ S
HA: βk > 0 HA: βk > S
H0: βk ≥ 0 H0: βk ≥ S
HA: βk < 0 HA: βk < S
For one-sided hypotheses around zero [or another hypothesized value, S] - 17Write out the specific rule for two-sided hypothesesH0: βk = 0 H0: βk = S
HA: βk ≠ 0 HA: βk ≠ S
For two-sided hypotheses around zero [or another hypothesized value, S] - 18What's the link between one-sided and two-sided critical values?The critical t-value of a one-sided test at a given level of significance (e.g. 5%) is the same as the critical t-value of a two-sided test at twice the level of significance (e.g. 10%)
tc=1.699 for one-sided, 5% significance
tc=1.699 for two-sided, 10% significance - 19How do you choose the level of significance?1. Must be chosen before finding a critical value
2. It shows the probability of observing an estimated t-value higher than the critical t-value if H0 were correct
3. Effectively measures the amount of Type 1 error implied by a particular critical t-value - 20What is a confidence interval?A range that contains the true value of an item a specified percentage of the time
It is calculated using the estimated regression coefficient, the two-sided critical t-value and the standard error of the estimated coefficient - 21Formula of C.I.If a hypothesized value falls within the confidence interval, then we cannot reject the null hypothesis

- 22What is a p-value?Probability of observing a t-score that size or larger (in absolute value) if the null hypothesis were true.
p-value decision rule: Reject H0 if
p-valueK < the level of significance (5% etc.)
and if β(hat)K has the sign implied by HA. - 23What are the limitations of the t-test?1. It does not test theoretical validity
- only makes inferences about a population coefficient based on an estimate from a sample
- a statistically significant result does not automatically make it theoretically correct - 24What are the limitations of the test?2Does not test importance of coefficients
Statistical significance indicates the likelihood that a particular sample result could have been obtained by chance.
It says little, if anything, about which variables determine the major portion of the variation in the dependent variable - 25What are the limitations of the t-test3. Its not meant for tests of the entire population
- as the sample size approaches the population (s.e. will approach 0—since S.E. decreases as N increases), the t-score will approach infinity - 26What does the t-test do essentially?All the t-test does is help decide how likely it is that a particular small sample will cause a researcher to make a mistake in rejecting hypotheses about the true population parameters.
Informações
- Descrição
- Business/Economics FlashCards sobre EDA Hypothesis Testing, criado por Felix Culas em 05-04-2017.
- Criado por
- Felix Culas
- Visualizações
- 0
- Avaliação