
Flashcards
stats final
Flashcards do conjunto (41)
- 1what are the principles of the central limit theorem?-the central theorem dictates that if we collect an infinite number of random samples of size n and plot the sample means, those sample means will be...
1. distributed normally
2. with the mean and of the sampling distribution equal to the true population mean
which is true regardless of the pop. distribution - 2what is the population parameter?Population parameter: the true value of population characteristic
ex. mean, variance - 3what is a sample statistic?sample stat: estimate of the population parameter from sample
- 4what is a statistical inference?stat inference: using samples to make probabilistic claims about population
- 5what is a sampling distribution?sampling distrib: it is a probability distribution of a statistic obtained through a large number of samples drawn from a specific population
ex. if wanted to find out the sampling distribution of SAT scores for all U.S. high school students in a given year you would take repeated random samples of high school students from the general population and then compute the average test score for each sample
The distribution of those sample means would provide you with the sampling distribution for the average SAT test score. - 6what is the standard error?standard error: Standard deviation of the sampling distribution
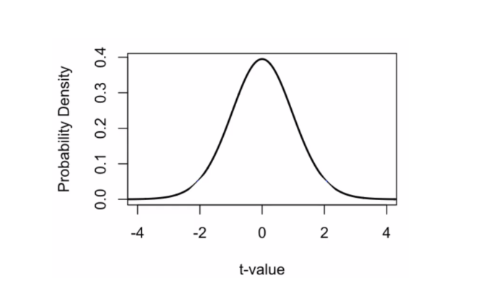
- 7what type of distribution is this? and how do u know?-It is a normal distribution because it is symmetic and bell-shaped
- 8what does degrees of freedom mean/refer to?j,g
- 9what are the steps of calculating a confidence interval?1. Calculate what we can know about the sample (mean and standard deviation)
2. Calculate the standard error
3. Determine confidence level
4. Calculate confidence interval - 10what are the pros and cons of bivariate hypothesis tests?pros:
-allow us to establish covariation between two variables
cons:
they don't allow us to...
1. control for confounding variables
2. guard against reverse causality - 11True or False: hypothesis tests are performed on the alternative hypothesis?false, they are performed on the null
- 12What does the P-value tell us? What does this information help us to determine?-P-value measures the lack of fit between our null hypothesis and our data
-it tells us whether we accept or reject the null hypothesis
-if the p-value is sufficiently low we can reject the null hypothesis - 13True or False: if our p-value is sufficiently high, we should accept the null hypothsisFalse, if the p-value is sufficiently low we can reject the null hypothesis
- 14How do we know if a relationship is statistically significant?stat significance: if the calculated p-value is less than the pre-determined or critical p-value
- 15what is the critical p value for a 95 percent confidence interval?0.05
- 16what are the 5 steps for hypothesis testing?1. State the hypotheses
2. Identify a null sampling distribution
3. Identify a critical p-value or test statistic 4. Calculate the test statistic
5. Compare the critical and calculated values and interpret the results - 17what is the difference of means test for?DOM: used to test relationships b/w continuous dependent and categorical independent variables
- 18what are the limits of p-values?1. p-values are only valid if the sample data are drawn randomly
2. p-values don't necessarily imply causation
3. statistical significance is often conflated with substantive significance
4. rejection of the null is often based on strict and arbitrary cutoffs leading to simplistic and binary conclusions - 19What are the 3 things to know about this statistic?1.test scores are always positive b/c e square the observed and expected frequencies
2. tests are always one-tailed
3. the test is only valid if...
i) no cells have expected frequency of less than 1
ii) less than 20% of cell shave expected frequency of less than 5
- 20What is the basic idea behind a two-variable regression?2-variable regression: fitting the best line through a scatter plot of data
- 21what is this equation used for and what does each variable stand for?a) the slope of a line
m=slope
b=y-intercept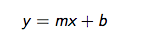
- 22what does the presence of this symbol mean in a sample regression model?The hat symbol helps us to distinguish between population parameters and estimates by placing them over estimates

- 23What does Residual mean in terms of a sample regression model?residual: refers to what is left over
- 24What is the goal of a bivariate regression?Goal of BR: draw a straight line describing the relationship between x and y
-our line should come as close as possible to the cases in the scatter plot - 25What does an OLS regression do?OLS: fitting a line that minimizes sum of squared errors or residuals
- 26What does 'Goodness of fit' refer to? And how is it assessed?a) overall fit b/w the regression model and the dependent variable
b) Measures:
i) root MSE
ii) r-squared - 27What is the Root MSE? What does it measure?Root MSE: means the root mean squared error and measures how many units on average the regression model is off in rpedicting values of the DV
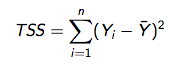
- 28What is the total sum of squares?TSS: measures variation in Y
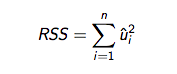
- 29what is the residual sum of squares?RSS: variation not explained by the model
- 30What is the Model sum of squares?MSS: variation explained by the model
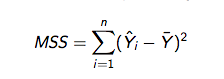
- 31What is R-squared?R-squared: proportion of variation of the DV explained by the model
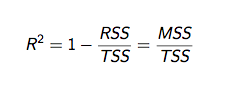
- 32If the regression coefficient is 704.02, what is the 'sign'?sign: positive
- 33What is this the formula for?Confidence intervals
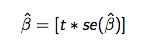
- 34What are the 5 assumptions about population scholastic component?
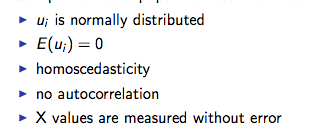
- 35What are the 2 assumptions about model specification?

- 36What are the minimal mathematical requirements? (for population stochastic component + model specification)
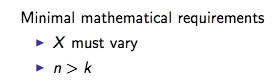
- 37Population errors or residuals are normally distributed. Why is this important? (3)1. if residuals are normally distributed, the sampling distribution of our parameter estimates are normally distributed as well
2. allows us to use t-table to make probabilistic inferences about population regression model from our parameter estimates
3. allows us to calcuate valid confidnece intervals and tests of statistical significance - 38what is the zero bias assumption? why is it importantE(ui)=0
a) the expected or mean value of ui is 0
b) if we expect ui values to be something other than 0 it suggests our model is missing an explanatory variable (aka omitted variable bias)
-however no all ui values will equal 0 - 39what does homoscedasticity mean?variance for ui is uniform for all values of the independent variable
- 40what does heteroscedastcity mean?variance for ui, isnt uniform for all values of independent variables (common problem with cross-sectional data)
- 41—
Informações
- Descrição
- FlashCards sobre stats final , criado por n sans em 22-04-2017.
- Criado por
- n sans
- Visualizações
- 0
- Avaliação