
Mapa mental
Cranedale
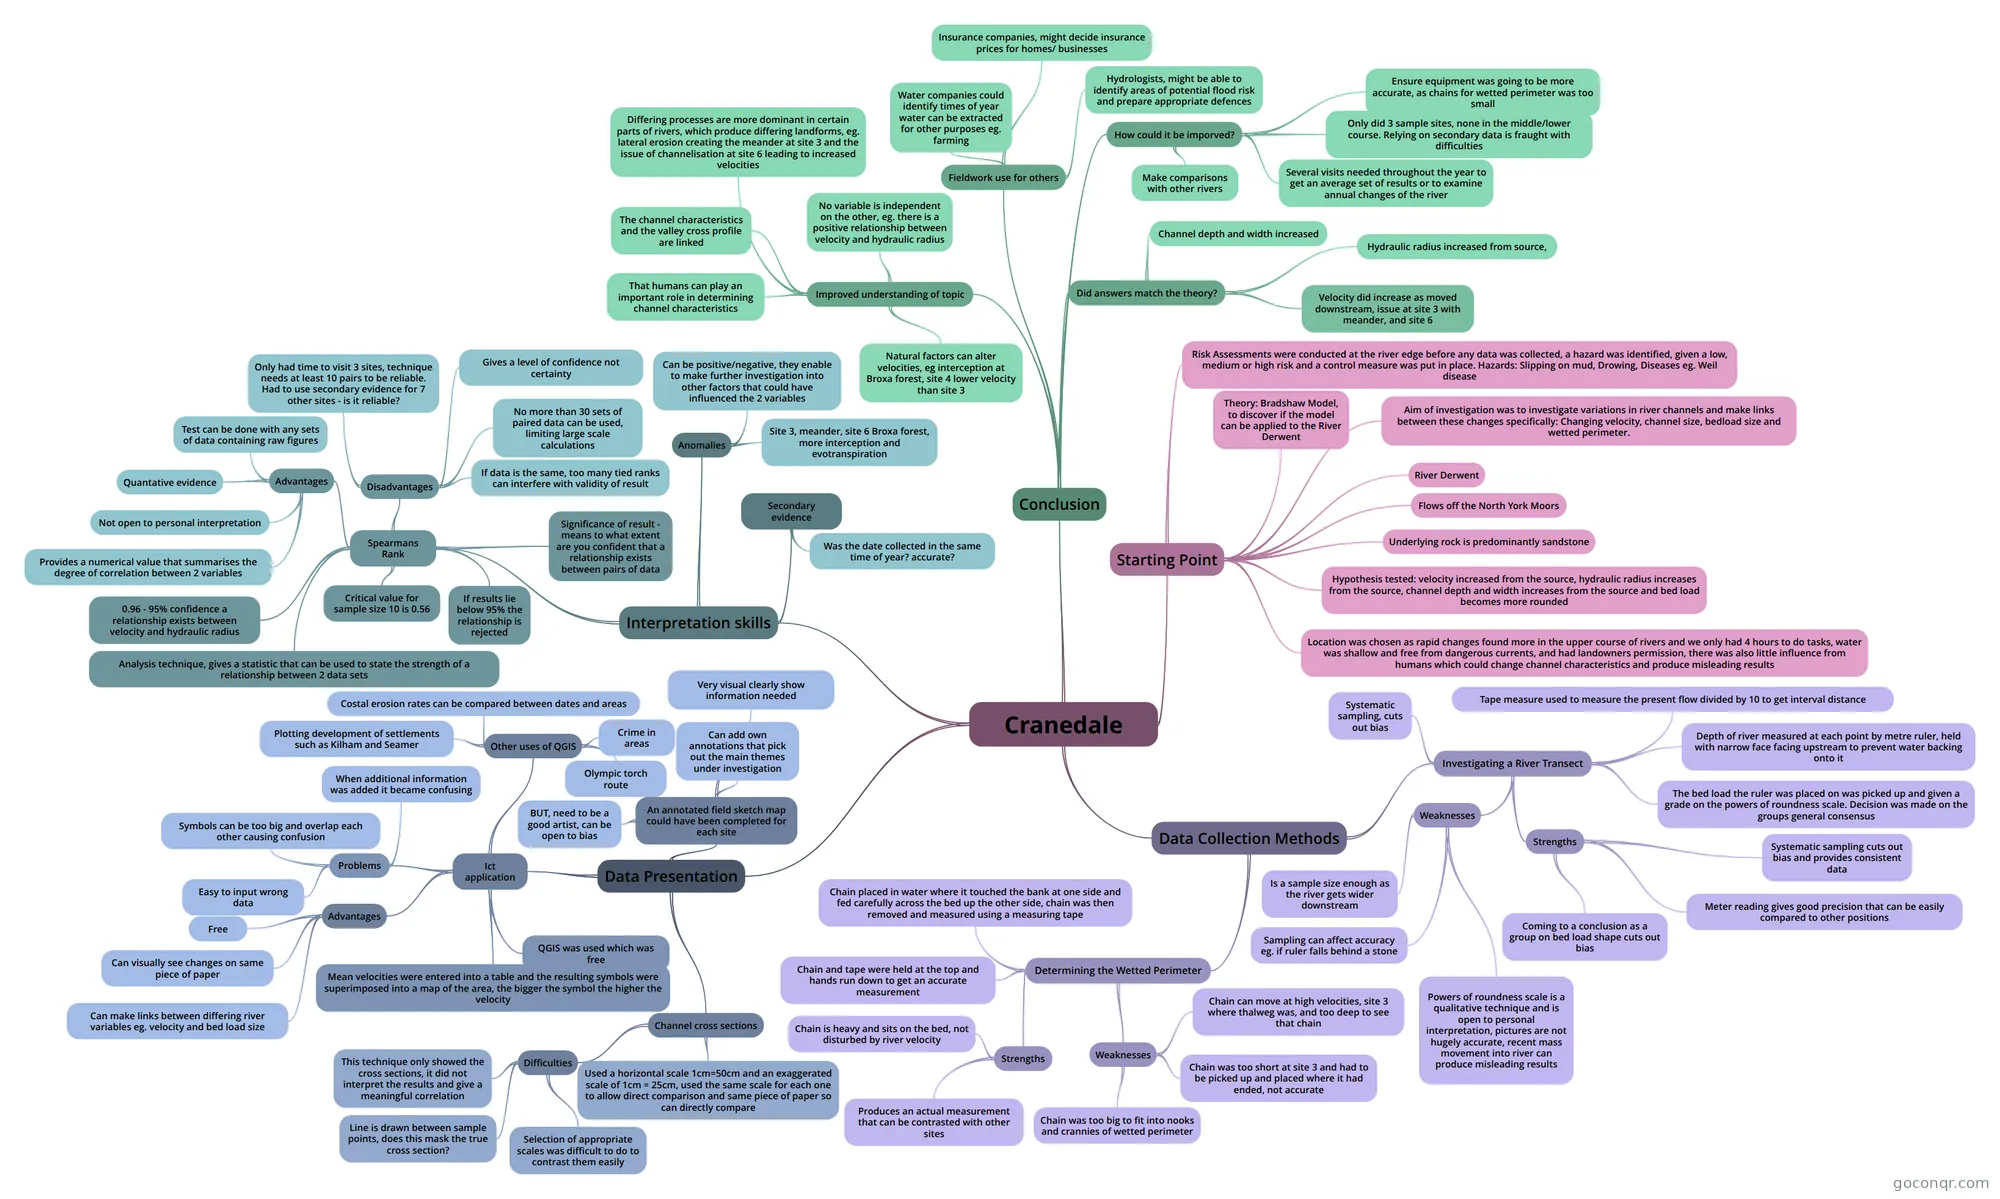
Mind map: Cranedale river fieldwork
Conteúdo do mapa
Cranedale
Starting Point
- River Derwent
- Flows off the North York Moors
- Underlying rock is predominantly sandstone
- Aim of investigation was to investigate variations in river channels and make links between these changes specifically: Changing velocity, channel size, bedload size and wetted perimeter.
- Theory: Bradshaw Model, to discover if the model can be applied to the River Derwent
- Hypothesis tested: velocity increased from the source, hydraulic radius increases from the source, channel depth and width increases from the source and bed load becomes more rounded
- Location was chosen as rapid changes found more in the upper course of rivers and we only had 4 hours to do tasks, water was shallow and free from dangerous currents, and had landowners permission, there was also little influence from humans which could change channel characteristics and produce misleading results
- Risk Assessments were conducted at the river edge before any data was collected, a hazard was identified, given a low, medium or high risk and a control measure was put in place. Hazards: Slipping on mud, Drowing, Diseases eg. Weil disease
Data Collection Methods
- Investigating a River Transect
- Systematic sampling, cuts out bias
- Tape measure used to measure the present flow divided by 10 to get interval distance
- Depth of river measured at each point by metre ruler, held with narrow face facing upstream to prevent water backing onto it
- The bed load the ruler was placed on was picked up and given a grade on the powers of roundness scale. Decision was made on the groups general consensus
- Strengths
- Systematic sampling cuts out bias and provides consistent data
- Meter reading gives good precision that can be easily compared to other positions
- Coming to a conclusion as a group on bed load shape cuts out bias
- Weaknesses
- Is a sample size enough as the river gets wider downstream
- Sampling can affect accuracy eg. if ruler falls behind a stone
- Powers of roundness scale is a qualitative technique and is open to personal interpretation, pictures are not hugely accurate, recent mass movement into river can produce misleading results
- Determining the Wetted Perimeter
- Chain placed in water where it touched the bank at one side and fed carefully across the bed up the other side, chain was then removed and measured using a measuring tape
- Chain and tape were held at the top and hands run down to get an accurate measurement
- Strengths
- Chain is heavy and sits on the bed, not disturbed by river velocity
- Produces an actual measurement that can be contrasted with other sites
- Weaknesses
- Chain was too big to fit into nooks and crannies of wetted perimeter
- Chain was too short at site 3 and had to be picked up and placed where it had ended, not accurate
- Chain can move at high velocities, site 3 where thalweg was, and too deep to see that chain
- Investigating a River Transect
Data Presentation
- Channel cross sections
- Used a horizontal scale 1cm=50cm and an exaggerated scale of 1cm = 25cm, used the same scale for each one to allow direct comparison and same piece of paper so can directly compare
- Difficulties
- Selection of appropriate scales was difficult to do to contrast them easily
- Line is drawn between sample points, does this mask the true cross section?
- This technique only showed the cross sections, it did not interpret the results and give a meaningful correlation
- Ict application
- QGIS was used which was free
- Mean velocities were entered into a table and the resulting symbols were superimposed into a map of the area, the bigger the symbol the higher the velocity
- Problems
- Easy to input wrong data
- Symbols can be too big and overlap each other causing confusion
- When additional information was added it became confusing
- Advantages
- Free
- Can visually see changes on same piece of paper
- Can make links between differing river variables eg. velocity and bed load size
- Other uses of QGIS
- Costal erosion rates can be compared between dates and areas
- Plotting development of settlements such as Kilham and Seamer
- Crime in areas
- Olympic torch route
- An annotated field sketch map could have been completed for each site
- Can add own annotations that pick out the main themes under investigation
- Very visual clearly show information needed
- BUT, need to be a good artist, can be open to bias
- Channel cross sections
Interpretation skills
- Spearmans Rank
- Analysis technique, gives a statistic that can be used to state the strength of a relationship between 2 data sets
- 0.96 - 95% confidence a relationship exists between velocity and hydraulic radius
- Critical value for sample size 10 is 0.56
- Advantages
- Provides a numerical value that summarises the degree of correlation between 2 variables
- Not open to personal interpretation
- Quantative evidence
- Test can be done with any sets of data containing raw figures
- Disadvantages
- Only had time to visit 3 sites, technique needs at least 10 pairs to be reliable. Had to use secondary evidence for 7 other sites - is it reliable?
- No more than 30 sets of paired data can be used, limiting large scale calculations
- Gives a level of confidence not certainty
- If data is the same, too many tied ranks can interfere with validity of result
- Significance of result - means to what extent are you confident that a relationship exists between pairs of data
- If results lie below 95% the relationship is rejected
- Anomalies
- Site 3, meander, site 6 Broxa forest, more interception and evotranspiration
- Can be positive/negative, they enable to make further investigation into other factors that could have influenced the 2 variables
- Secondary evidence
- Was the date collected in the same time of year? accurate?
- Spearmans Rank
Conclusion
- Did answers match the theory?
- Velocity did increase as moved downstream, issue at site 3 with meander, and site 6
- Channel depth and width increased
- Hydraulic radius increased from source,
- How could it be imporved?
- Only did 3 sample sites, none in the middle/lower course. Relying on secondary data is fraught with difficulties
- Several visits needed throughout the year to get an average set of results or to examine annual changes of the river
- Ensure equipment was going to be more accurate, as chains for wetted perimeter was too small
- Make comparisons with other rivers
- Fieldwork use for others
- Hydrologists, might be able to identify areas of potential flood risk and prepare appropriate defences
- Insurance companies, might decide insurance prices for homes/ businesses
- Water companies could identify times of year water can be extracted for other purposes eg. farming
- Improved understanding of topic
- No variable is independent on the other, eg. there is a positive relationship between velocity and hydraulic radius
- Differing processes are more dominant in certain parts of rivers, which produce differing landforms, eg. lateral erosion creating the meander at site 3 and the issue of channelisation at site 6 leading to increased velocities
- The channel characteristics and the valley cross profile are linked
- That humans can play an important role in determining channel characteristics
- Natural factors can alter velocities, eg interception at Broxa forest, site 4 lower velocity than site 3
- Did answers match the theory?
Informações
- Descrição
- A level Geography Mapa Mental sobre Cranedale, criado por Lucy Puddephatt em 27-02-2017.
- Criado por
- Lucy Puddephatt
- Visualizações
- 5
- Avaliação