
Mapa mental
QUALITY MODELS AND TOOLS
Conteúdo do mapa
QUALITY MODELS AND TOOLS
Benchmarking
- It is a systematic and continuous process to comparatively evaluate products, services and / or work processes in a certain area of interest, in order to highlight the possible practical improvements and to apply them in the own activities, in order to add value to the activity of the company.
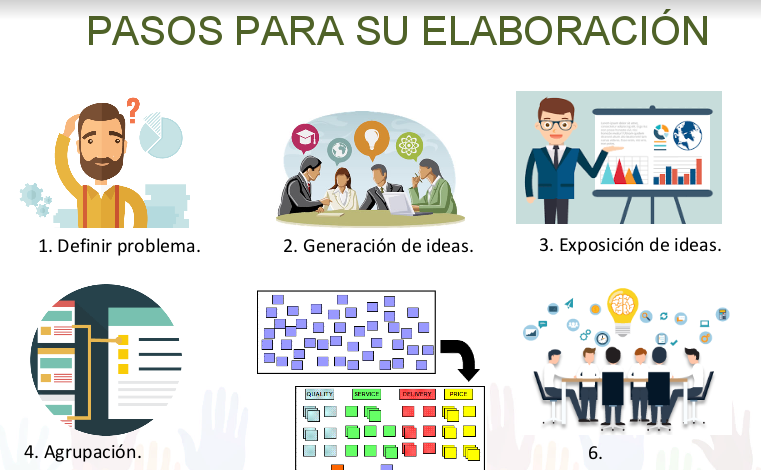
Affinity diagram
- It is a group technique that helps to understand the structure of a global problem through the analysis of the verbal affinities
Check list
- It is created to monitor compliance with a list of requirements or collect data in an orderly and systematic manner
- Are used to make systematic checks of activities or products making sure that the worker or inspector does not forget anything important.
- It is created to monitor compliance with a list of requirements or collect data in an orderly and systematic manner
Kaizen, It is based on the development of a culture, providing participation to all workers, from the high management to the staff.
- "Today better than yesterday and tomorrow better than today"
brainstorming
- Brainstorming is a technique of group to generate original ideas about a specific issue or problem in a relaxed environment in the shortest possible time
5 why, systematic technique that is to examine any problem doing the question "WHY?", To find the cause of it.
- It is useful to define the true problem, this allows analyzing and make the most appropriate decisions to the real problem.
Six Sigma, Induce to know each and every one of the processes that integrate a company, and based on the needs of the clients both both internal and external.
- there can only be 3.4 defects per million products
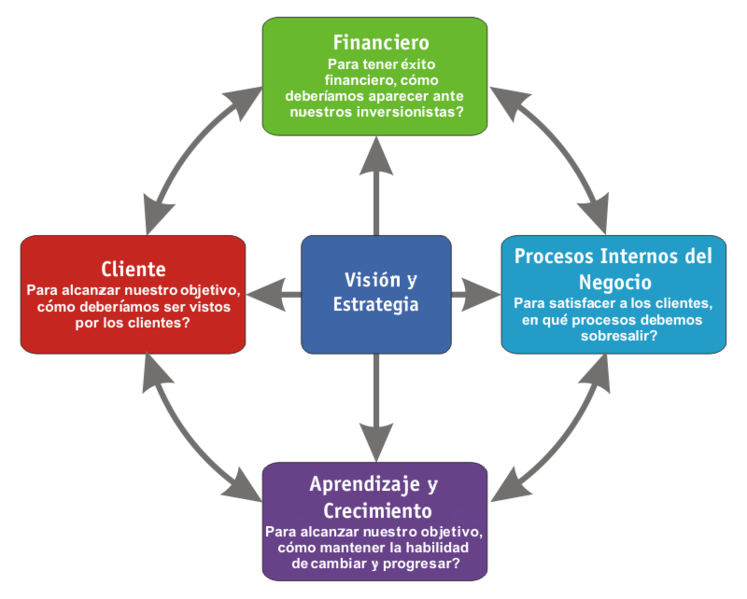
Balanced scorecard, It is defined as a tool that allows linking key strategies and objectives with performance and results across four critical areas in any company: performance financial, customer awareness, internal business processes and learning and growth
Diagram causes effect, is a tool that represents the relationship between an effect (problem) and all possible causes that cause it.
- Handled with 5M: materials, labor, environment, machinery and method, then identify the causes that have more relevance
Imagens e arquivos do mapa

Informações
- Descrição
- Ingeniería Mapa Mental sobre QUALITY MODELS AND TOOLS, criado por diana mendez em 23-09-2017.
- Criado por
- diana mendez
- Visualizações
- 0
- Avaliação