
Mapa mental
Quality tools
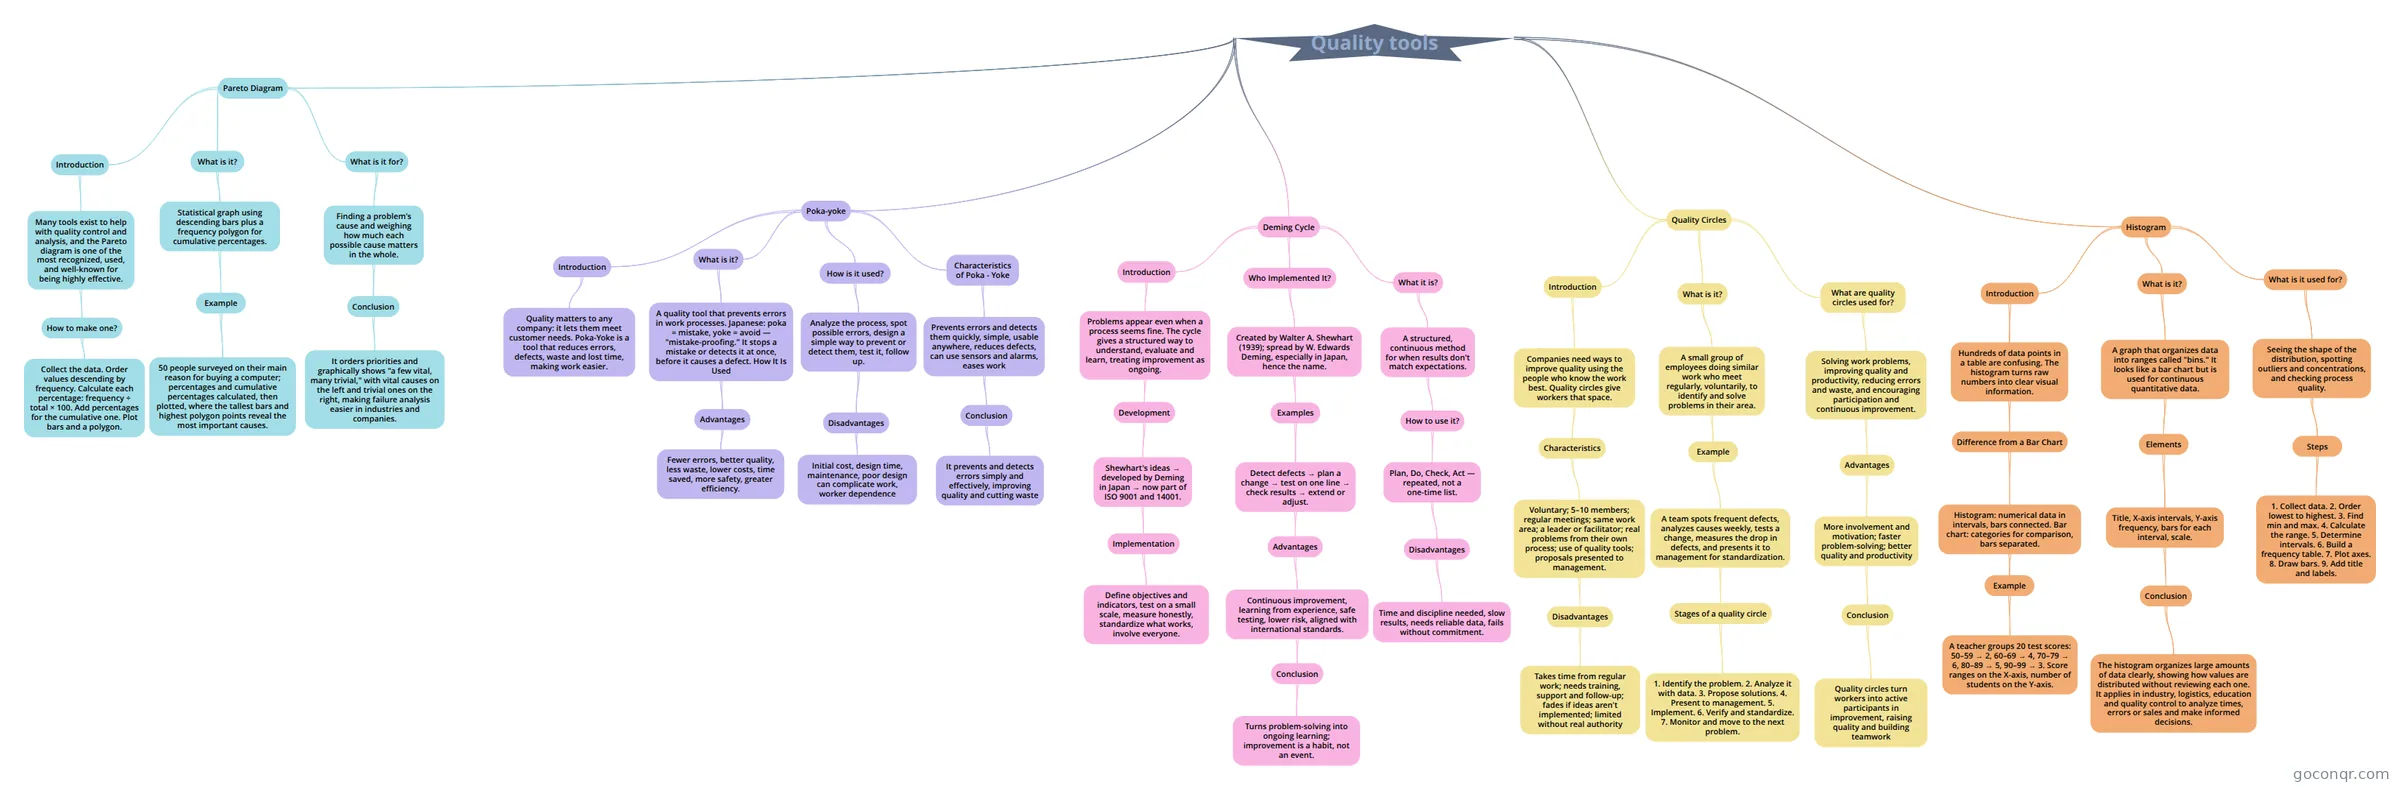
Mind map: Quality tools
Conteúdo do mapa
Quality tools
Pareto Diagram
- What is it?
- Statistical graph using descending bars plus a frequency polygon for cumulative percentages.
- Example
- 50 people surveyed on their main reason for buying a computer; percentages and cumulative percentages calculated, then plotted, where the tallest bars and highest polygon points reveal the most important causes.
- Example
- Statistical graph using descending bars plus a frequency polygon for cumulative percentages.
- What is it for?
- Finding a problem's cause and weighing how much each possible cause matters in the whole.
- Conclusion
- It orders priorities and graphically shows "a few vital, many trivial," with vital causes on the left and trivial ones on the right, making failure analysis easier in industries and companies.
- Conclusion
- Finding a problem's cause and weighing how much each possible cause matters in the whole.
- Introduction
- Many tools exist to help with quality control and analysis, and the Pareto diagram is one of the most recognized, used, and well-known for being highly effective.
- How to make one?
- Collect the data. Order values descending by frequency. Calculate each percentage: frequency ÷ total × 100. Add percentages for the cumulative one. Plot bars and a polygon.
- How to make one?
- Many tools exist to help with quality control and analysis, and the Pareto diagram is one of the most recognized, used, and well-known for being highly effective.
- What is it?
Poka-yoke
- Introduction
- Quality matters to any company: it lets them meet customer needs. Poka-Yoke is a tool that reduces errors, defects, waste and lost time, making work easier.
- What is it?
- A quality tool that prevents errors in work processes. Japanese: poka = mistake, yoke = avoid — "mistake-proofing." It stops a mistake or detects it at once, before it causes a defect. How It Is Used
- Advantages
- Fewer errors, better quality, less waste, lower costs, time saved, more safety, greater efficiency.
- Advantages
- A quality tool that prevents errors in work processes. Japanese: poka = mistake, yoke = avoid — "mistake-proofing." It stops a mistake or detects it at once, before it causes a defect. How It Is Used
- How is it used?
- Analyze the process, spot possible errors, design a simple way to prevent or detect them, test it, follow up.
- Disadvantages
- Initial cost, design time, maintenance, poor design can complicate work, worker dependence
- Disadvantages
- Analyze the process, spot possible errors, design a simple way to prevent or detect them, test it, follow up.
- Characteristics of Poka - Yoke
- Prevents errors and detects them quickly, simple, usable anywhere, reduces defects, can use sensors and alarms, eases work
- Conclusion
- It prevents and detects errors simply and effectively, improving quality and cutting waste
- Conclusion
- Prevents errors and detects them quickly, simple, usable anywhere, reduces defects, can use sensors and alarms, eases work
- Introduction
Quality Circles
- Introduction
- Companies need ways to improve quality using the people who know the work best. Quality circles give workers that space.
- Characteristics
- Voluntary; 5–10 members; regular meetings; same work area; a leader or facilitator; real problems from their own process; use of quality tools; proposals presented to management.
- Disadvantages
- Takes time from regular work; needs training, support and follow-up; fades if ideas aren't implemented; limited without real authority
- Disadvantages
- Voluntary; 5–10 members; regular meetings; same work area; a leader or facilitator; real problems from their own process; use of quality tools; proposals presented to management.
- Characteristics
- Companies need ways to improve quality using the people who know the work best. Quality circles give workers that space.
- What is it?
- A small group of employees doing similar work who meet regularly, voluntarily, to identify and solve problems in their area.
- Example
- A team spots frequent defects, analyzes causes weekly, tests a change, measures the drop in defects, and presents it to management for standardization.
- Stages of a quality circle
- 1. Identify the problem. 2. Analyze it with data. 3. Propose solutions. 4. Present to management. 5. Implement. 6. Verify and standardize. 7. Monitor and move to the next problem.
- Stages of a quality circle
- A team spots frequent defects, analyzes causes weekly, tests a change, measures the drop in defects, and presents it to management for standardization.
- Example
- A small group of employees doing similar work who meet regularly, voluntarily, to identify and solve problems in their area.
- What are quality circles used for?
- Solving work problems, improving quality and productivity, reducing errors and waste, and encouraging participation and continuous improvement.
- Advantages
- More involvement and motivation; faster problem-solving; better quality and productivity
- Conclusion
- Quality circles turn workers into active participants in improvement, raising quality and building teamwork
- Conclusion
- More involvement and motivation; faster problem-solving; better quality and productivity
- Advantages
- Solving work problems, improving quality and productivity, reducing errors and waste, and encouraging participation and continuous improvement.
- Introduction
Histogram
- Introduction
- Hundreds of data points in a table are confusing. The histogram turns raw numbers into clear visual information.
- Difference from a Bar Chart
- Histogram: numerical data in intervals, bars connected. Bar chart: categories for comparison, bars separated.
- Example
- A teacher groups 20 test scores: 50–59 → 2, 60–69 → 4, 70–79 → 6, 80–89 → 5, 90–99 → 3. Score ranges on the X-axis, number of students on the Y-axis.
- Example
- Histogram: numerical data in intervals, bars connected. Bar chart: categories for comparison, bars separated.
- Difference from a Bar Chart
- Hundreds of data points in a table are confusing. The histogram turns raw numbers into clear visual information.
- What is it?
- A graph that organizes data into ranges called "bins." It looks like a bar chart but is used for continuous quantitative data.
- Elements
- Title, X-axis intervals, Y-axis frequency, bars for each interval, scale.
- Conclusion
- The histogram organizes large amounts of data clearly, showing how values are distributed without reviewing each one. It applies in industry, logistics, education and quality control to analyze times, errors or sales and make informed decisions.
- Conclusion
- Title, X-axis intervals, Y-axis frequency, bars for each interval, scale.
- Elements
- A graph that organizes data into ranges called "bins." It looks like a bar chart but is used for continuous quantitative data.
- What is it used for?
- Seeing the shape of the distribution, spotting outliers and concentrations, and checking process quality.
- Steps
- 1. Collect data. 2. Order lowest to highest. 3. Find min and max. 4. Calculate the range. 5. Determine intervals. 6. Build a frequency table. 7. Plot axes. 8. Draw bars. 9. Add title and labels.
- Steps
- Seeing the shape of the distribution, spotting outliers and concentrations, and checking process quality.
- Introduction
Deming Cycle
- Introduction
- Problems appear even when a process seems fine. The cycle gives a structured way to understand, evaluate and learn, treating improvement as ongoing.
- Development
- Shewhart's ideas → developed by Deming in Japan → now part of ISO 9001 and 14001.
- Implementation
- Define objectives and indicators, test on a small scale, measure honestly, standardize what works, involve everyone.
- Implementation
- Shewhart's ideas → developed by Deming in Japan → now part of ISO 9001 and 14001.
- Development
- Problems appear even when a process seems fine. The cycle gives a structured way to understand, evaluate and learn, treating improvement as ongoing.
- Who Implemented It?
- Created by Walter A. Shewhart (1939); spread by W. Edwards Deming, especially in Japan, hence the name.
- Examples
- Detect defects → plan a change → test on one line → check results → extend or adjust.
- Advantages
- Continuous improvement, learning from experience, safe testing, lower risk, aligned with international standards.
- Conclusion
- Turns problem-solving into ongoing learning; improvement is a habit, not an event.
- Conclusion
- Continuous improvement, learning from experience, safe testing, lower risk, aligned with international standards.
- Advantages
- Detect defects → plan a change → test on one line → check results → extend or adjust.
- Examples
- Created by Walter A. Shewhart (1939); spread by W. Edwards Deming, especially in Japan, hence the name.
- What it is?
- A structured, continuous method for when results don't match expectations.
- How to use it?
- Plan, Do, Check, Act — repeated, not a one-time list.
- Disadvantages
- Time and discipline needed, slow results, needs reliable data, fails without commitment.
- Disadvantages
- Plan, Do, Check, Act — repeated, not a one-time list.
- How to use it?
- A structured, continuous method for when results don't match expectations.
- Introduction
Informações
- Descrição
- Mapa Mental sobre Quality tools, criado por Euni Euni em 18-10-2026.
- Criado por
- Euni Euni
- Visualizações
- 1
- Avaliação
Mais sobre Quality Tools and Techniques