
Mapa mental
Rivers, Floods and Management: River Processes and the Hjulstrom Curve
Conteúdo do mapa
Rivers, Floods and Management: River Processes and the Hjulstrom Curve
Energy in a River
- The amount of energy available in a river to do 'work' depends on: the height of the water has to descend (and its gradient) - this is essentially gravity. And the amount (or mass) of water available.
- Potential energy is stored energy in a still body of water that has the potential to do 'work'.
- Kinetic energy is when water moves downhill, potential energy is converted to kinetic energy and is used to do 'work'
- Some energy is lost overcoming friction, so the amount of kinetic energy generated is less than the amount of potential energy.
River Transportation
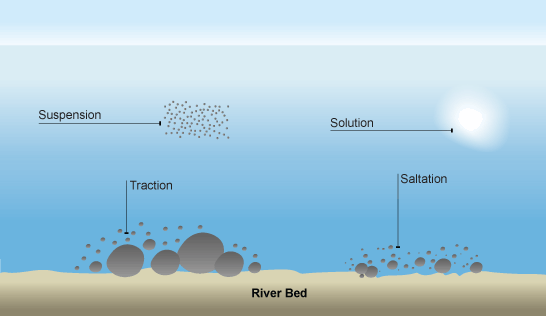
- The sediment carried by a river is known as its load.
- Dissolved Load (Solution): Is the invisible transport of chemicals dissolved in the water. A common example is calcium carbonate which is dissolved when rain water flows over (or through#0 limestone or chalk.
- Suspension: Is usually very fine-grained mud and silt, which is carried within the main body of water. It is this form of sediment transport that makes rivers look dark and murky.
- Traction: Is the transportation of large boulders or rocks that roll along the river bed.
- Saltation: Is the transportation of small rocks or pebbles that bounce along the river bed.
- The type and amount of sediment transported by a river depends on several factors:
- Flow of the river, with most transportation occurring during high-flow conditions.
- The nature of the riverbed and banks. If the river is flowing through loose material, such as sands and gravels, it is more likely to pick up and carry sediment than if it is flowing over solid rock.
- Human intervention, such as lining riverbanks with concrete, will reduce the amount of available sediment for transport.
River Erosion
- Corrasion: Particles of rock carried by the river scrape away at the riverbed and banks. if a river is flowing over bare rocks, a sandpapering effect may occur - resulting in a smooth rock surface. This particular process is called abrasion.
- Hydraulic Action: When the sheer power of moving water is able to dislodge loose particles of rock from the riverbed or banks. Hydraulic action is most effective during times of high flow, when the water forces itself strongly against the banks, particularly on the outside bends of meanders.
- Solution: Is the dissolving of chemicals when a river flows over rocks such as limestone and chalk.
- Attrition: Is an extra process of erosion. It involves the bashing together of rock particles as they are carried downstream by a river.
River Deposition
- Deposition occurs when a river no longer has enough energy to transport its load.
- Friction with the riverbed and banks leads to considerable deposition within the river channel itself. This explains why most rivers flow over sediment, rather than over bare rock.
- Large amounts of sediment are also deposited when a river enters the sea, or a lake, where the rate of flow is suddenly reduced.
The Hjulstrom Curve
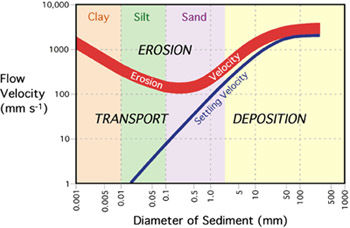
- The main factor that controls transportation, erosion and deposition is the speed or velocity of a river.
- The relationship between river processes and velocity is shown by a graph called the Hjulstrom curve
- Both axes are logarithmic, which means that there is a ten-fold increase between each of the equally spaced points on the axes
- A logarithmic scale is commonly used when a wide range of values has to be plotted on a single graph.
- The critical erosion velocity line (the red line, in this case) indicates the velocity needed to pick up (erode) particles of different sizes.
- The critical deposition velocity line (the blue line, in this case) indicates the velocity below which particles of a particular size can no longer be carried and have to be deposited.
Imagens e arquivos do mapa
Informações
- Descrição
- A Levels Geography (Physical Geography-AS) Mapa Mental sobre Rivers, Floods and Management: River Processes and the Hjulstrom Curve, criado por Andrew_Ellinas em 03-04-2014.
- Criado por
- Andrew_Ellinas
- Visualizações
- 267
- Avaliação