
Mapa mental
DR by Principal Component Analysis
Conteúdo do mapa
DR by Principal Component Analysis
WHAT?
- It is a data reduction technique that aims to reduce the dimensionality (i.e., the number of attributes) of data while retaining as much information as possible in the dataset.
- HOW?
- It uses linear transformation that maps data observations of higher dimensions to lower dimensions.
- Data observations of possibly correlated variables are converted in the procedure into a set of values of uncorrelated variables known as principal components.
- Principal components are linear combinations of the original variables and they are uncorrelated to one another due to the mathematical procedure used.
- Data observations of possibly correlated variables are converted in the procedure into a set of values of uncorrelated variables known as principal components.
- It uses linear transformation that maps data observations of higher dimensions to lower dimensions.
- HOW?
- It is a data reduction technique that aims to reduce the dimensionality (i.e., the number of attributes) of data while retaining as much information as possible in the dataset.
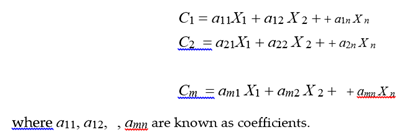
Suppose there are n original variables X1, X 2 , , X n . We can obtain m principal components, C1, C2 , , Cm from linear combinations of these n original variables:
- The coefficients a11, a12, , amn are selected such that the variance of C1 (first component) is the highest, followed by the variance of C2 (subsequent component), and then followed by the variance of C3 , and so on.
- In order to reduce the data volume, not all the principal components will be used to represent the original dataset, only those principal components with large variance will be selected, as they retain a substantial portion of the information contained in the original variables.
- In practice, one needs to decide on how many principal components to select.
- If our purpose is to draw a scatterplot to visualise high-dimensional data, we can choose the first two or three principal components.
- In practice, one needs to decide on how many principal components to select.
- In order to reduce the data volume, not all the principal components will be used to represent the original dataset, only those principal components with large variance will be selected, as they retain a substantial portion of the information contained in the original variables.
- The coefficients a11, a12, , amn are selected such that the variance of C1 (first component) is the highest, followed by the variance of C2 (subsequent component), and then followed by the variance of C3 , and so on.
Imagens e arquivos do mapa
Informações
- Descrição
- Mapa Mental sobre DR by Principal Component Analysis, criado por sue san em 11-02-2017.
- Criado por
- sue san
- Visualizações
- 2
- Avaliação