
Notas
12. Sampling and Hypothesis Testing - created from Mind Map
Conteúdo das notas (1)
Página 1
H0 is the Null hypothesis or default claim eg earth is round
H1 is Hypothesis and is what is not currently proven and rejects H0
Testing
Population v Sample
Sampling Methods
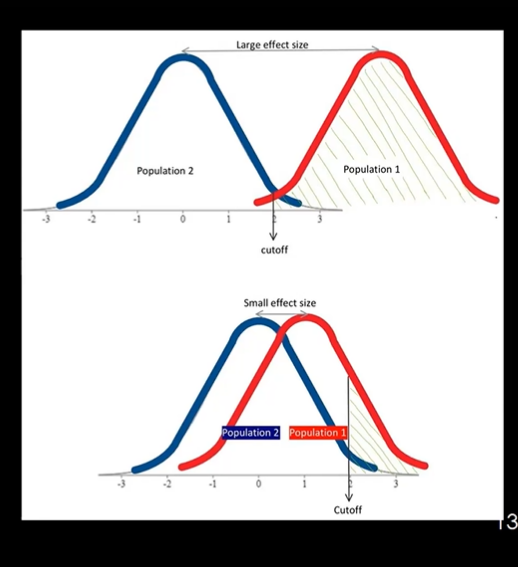
uses plot graph for null and H1 to see any difference
p-value
Type 1 error
The p-value given by a statistical test answers this question. It gives you the probability of obtaining a difference of this size or larger, assuming that the null hypothesis is true i.e., the chances that the result is a false positive Smaller p-values = good! Result “unlikely” to be due to chance
Rejecting the null hypothesis when it is actually true = Type 1 Error
An alpha of 0.05 indicates that you are willing to accept a 5% chance that you are wrong when you reject the null hypothesis. If alpha = 0.05, then p-values < .05 are “statistically significant”
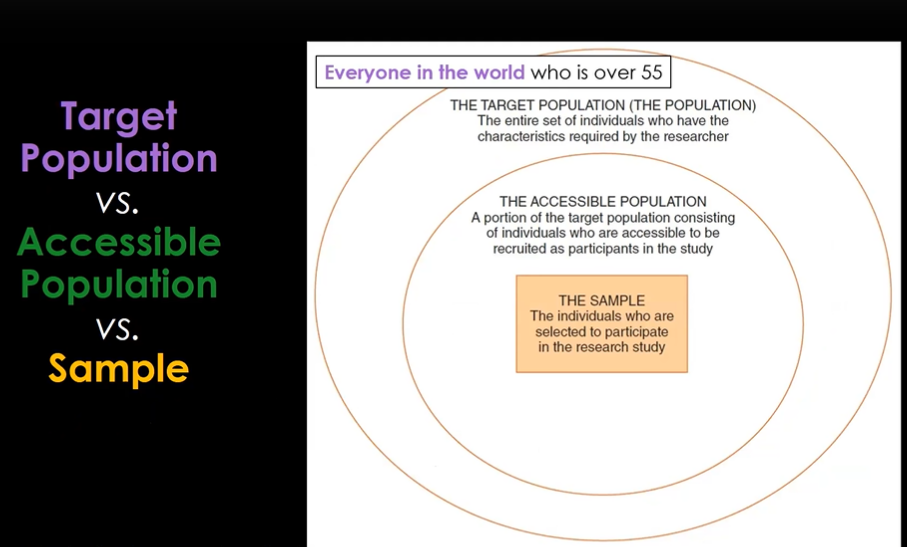
Population is all
Sample is represented group of population
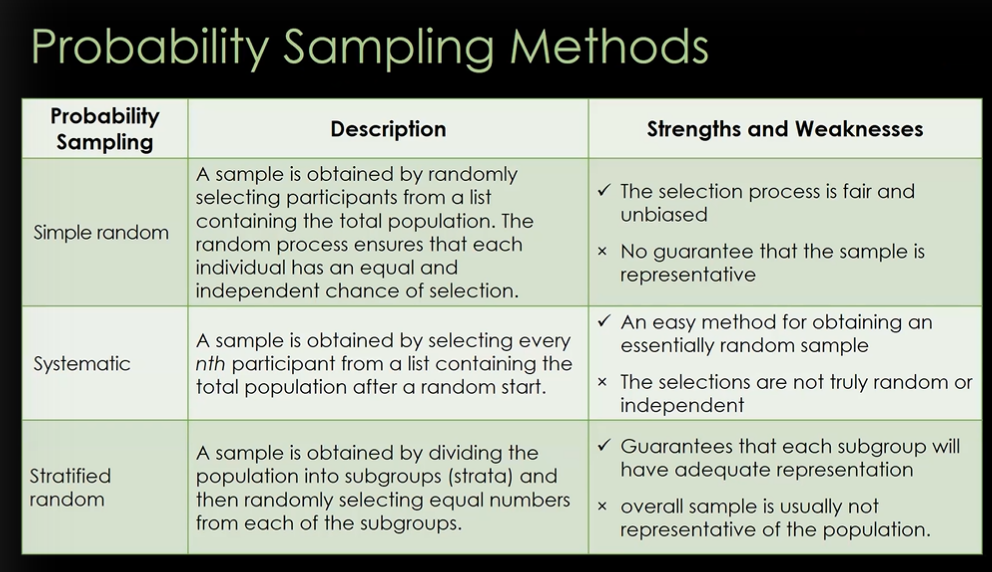
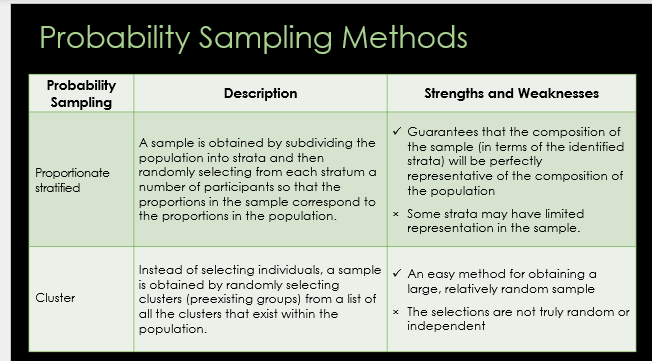
Probability Sampling
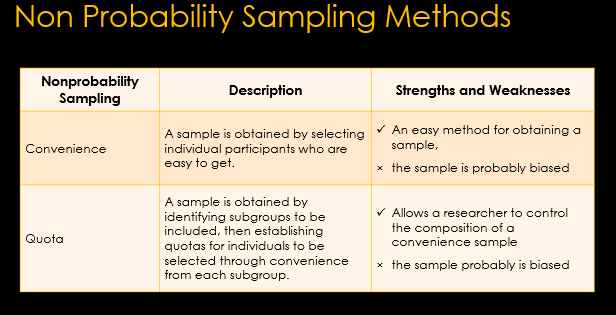
non-probability sampling
Informações
- Descrição
- Undergraduate Degree Psychology Introduction to Research Notas sobre 12. Sampling and Hypothesis Testing - created from Mind Map, criado por Shess 21 em 01-11-2022.
- Criado por
- Shess 21
- Visualizações
- 0
- Histórico
-
- Criado por Shess 21 · 1 nov 2022
- Copiado para Nota por Shess 21 · 1 nov 2022
- Avaliação