
Notas
Population - created from Mind Map
Conteúdo das notas (1)
Página 1
Birth rate – number of new individuals produced by sexual or asexual reproduction per unit time. Death rate – number of individuals dying per unit time. Immigration – new individuals joining a population. Emigration – individuals leaving a population
Fugitive species cannot tolerate competition. To increase in numbers they reproduce rapidly and have effective dispersal (spreading) mechanisms. They are able to invade new environments rapidly – algae and weeds are great examples of fugitive species.
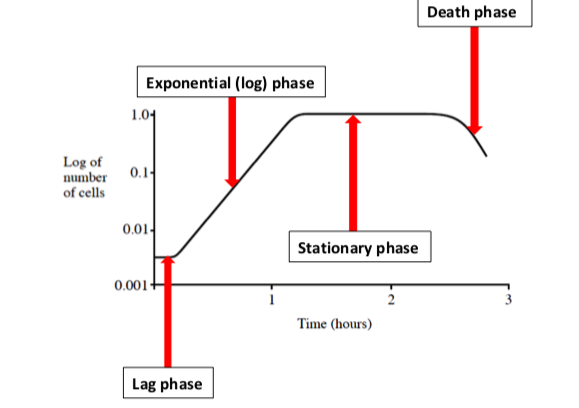
Equilibrium species control their population by competition within a stable habitat. Their usual pattern of growth is a sigmoid (S-shaped) curve called a one-step growth curve. Bacteria and rabbit populations show this kind of growth.
Lag phase – Bacteria adjust to their new environment and prepare for growth by synthesising enzymes. Exponential (log) phase – Bacteria cells replicate exponentially (double per unit time). There are no limiting factors. Stationary phase – Bacterial growth levels off as cell death equals the number of new cells produced by cell division. Factors such as nutrient supply have become limiting and waste products accumulate. Death phase – Cell death exceeds cell division. Nutrients are now depleted and waste products have reached toxic levels which inhibit growth.
Environmental resistance include all the factors that may limit population growth. Some factors will be biotic (living) and some will be abiotic (non-living).
Abiotic factors include temperature, pH, light intensity and water availability. Biotic factors include competition for limited resources between members of the same species (intraspecific competition) or competition between organisms of different species (interspecific competition). New diseases, parasitism and an increase in predator numbers are also biotic factors which limit population size.
The number of prey can limit the population growth of a predator population. The number of predators can limit the population growth of a prey population. Predator-prey interactions cause both populations to oscillate due to negative feedback mechanisms.
The carrying capacity is the maximum population size of a species that an environment can sustain. On the bacterial growth curve the carrying capacity corresponds to the stationary phase. The carrying capacity set point is shown as a dashed line on the graph below.
A population crash is a sudden dramatic decrease in population number; it occurs when a population greatly exceeds its carrying capacity. After a population crash the carrying capacity set point for that environment will be much lower; possibly due to damage caused to the environment by overpopulation.Pop growth - b+I -d+e
The effect of density dependent factors increases as the density of the population increases, they include:Competition (intraspecific and interspecific), Predation,Disease,Parasitism, These factors limit the maximum size of the population; they determine the carrying capacity.
Density independent factors are abiotic (non-living) and are not linked to population density. Examples include: Earthquakes ,Tsunami ,Volcanic eruptions ,Extreme weather such as flood or drought ,Wildfires
Abundance is the number of individuals, of the same species, in a given area or volume. Animal abundance can be assessed by:Capture-mark-recapture techniques. Individual organisms trapped or caught on day 1 are marked and then released. The same sampling technique is used on day 2. The following equation is used to determine population size: no day 1 x no day 2/ no in sample two which are marked. Kick sampling in a stream and counting freshwater invertebrates.
Random sampling using a quadrat to find the density of organisms in a given area (number of organisms per m2). Systematic sampling, using a transect, to determine changes in percentage cover of a species due to changes in abiotic factors e.g. salinity or light intensity.
An ecosystem is a characteristic community of interdependent species and their habitat. It is comprised of living (biotic) and non-living (abiotic) elements and is dynamic (changes over time).
Producers (trophic level 1) – Autotrophic organisms (plants and algae) which absorb light energy to convert simple inorganic compounds into more complex organic compounds such as carbohydrate. Consumers – Heterotrophic organisms which cannot fix carbon from inorganic sources like the producers do – they must ingest it or absorb organic carbon from other organisms.Herbivores (primary consumers at trophic level 2) – Animals which feed on organic matter produced by the producers.Carnivores – Feed on other animals at lower trophic levels Trophic level – An organism’s position within a food chain.Detritivores (earthworms, woodlice and maggots) feed on dead organic matter e.g. dead plants and animals.Decomposers, such as bacteria and fungi, break down organic compounds into simpler inorganic compounds, which are soluble and can be absorbed by plant roots.
NPP is the energy in plant biomass which could pass to the primary consumers at trophic level 2 during feeding. Not all NPP will be available to the herbivores as much of is inaccessible or indigestible – plant roots may not be easily reached and cellulose is indigestible as mammals cannot produce cellulase.
Much of the energy which reaches the producers as sunlight is never absorbed and is therefore unavailable for photosynthesis. The mains reasons include: Light is reflected from the leaf surface, Wrong wavelength of light which cannot be absorbed by the photosynthetic pigments, Light passes through the leaf and does not hit the photosynthetic pigments
amount of light made into biomass/amount of light hitting the leaf x100
GPP is the rate of production of chemical energy in biological molecules by photosynthesis per unit area and time (kJ m-2 y-1). Much of the GPP is used during respiration and some is lost as heat.
NPP=GPP - RESP
Secondary productivity is the rate at which heterotrophs accumulate energy in the form of new cells and tissues. Heterotrophs cannot fix carbon from inorganic sources like the producers do – they must ingest it or absorb organic carbon from other organisms (feed or consume). Heterotrophs include: animals, fungi, some bacteria and some protoctista. Herbivores have a lower secondary productivity than carnivores; carnivores are more efficient at energy conversion than herbivores. A carnivore’s protein-rich diet is more readily and efficiently digested and less energy is lost as waste.
ENERGY T EFFICIENCY - energy incorporated into biomass after transfer/ e before biomass x 100
Succession is a sequence of changes, in the composition of a community, over time. A succession will eventually lead to a stable climax community, which has high biodiversity and is highly productive. Each stage of a succession is called a sere.
Primary succession begins from bare rock or the site of a recent volcanic eruption. The first organisms to colonise the rock are the pioneer species, including lichens, mosses and algae.Pioneer species, such as the lichens on the right, change the rock surface by penetrating it (forming tiny cracks) and allowing humus (which retains water) to accumulate. This simple soil allows grasses and ferns to colonise the area (see below).Grasses and ferns further change the rock surface as their roots penetrate further and deeper. Death and decay over several generations allows more soil to accumulate and other higher plant species invade.As the community of plants becomes more diverse other organisms take advantage of the new habitats and food sources; the diversity of plants and animals increases. Eventually a climax community is established, where species are stable until the environment changes again. An example of a climax community would be woodland.
A secondary succession begins from bare soil. A climax community will be achieved much faster as the soil is already present and it may contain viable bulbs, seeds and spores. Bare soil can be exposed after a wildfire. Human activity may prevent a climax community being achieved. Examples of this include: Grazing sheep. Heather moorland management by controlled burning. Farming of land. Deforestation and soil erosion.
Informações
- Descrição
- Notas sobre Population - created from Mind Map, criado por Poppy Griffiths em 06-01-2020.
- Criado por
- Poppy Griffiths
- Visualizações
- 0
- Histórico
-
- Criado por Poppy Griffiths · 6 jan 2020
- Copiado para Nota por Poppy Griffiths · 6 jan 2020
- Avaliação