
Flashcards
AS level geography- Geographical Skills

Flashcards do conjunto (36)
- 1BASIC SKILLS~draw sketches
~ Analise photos
~label and annotate
~use overlays
~literacy skills - 2—INVESTIGATIVE SKILLS-
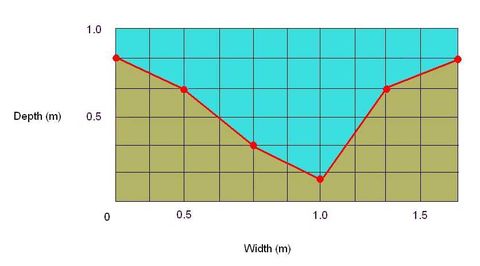
fieldwork investigation~ aims, hypothesis, data to collect, methods, (river measurements), Collecting data for river surveys- SPEED- 10m length, time it takes the float to cover the distance, repeat several times, find average time (surface speed), x0.8 (true speed across channel), CROSS-SECTIONAL AREA & WETTED PERIMETER- run tape across river bank to bank, depth at 50cm intervals, transfer to graph, can get info from that, RIVER DISCHARGE- speed x cross-sectional area - 3CARTOGRAPHIC SKILLS-> the reading and interpretation of maps
-> the production of maps in order to present information.
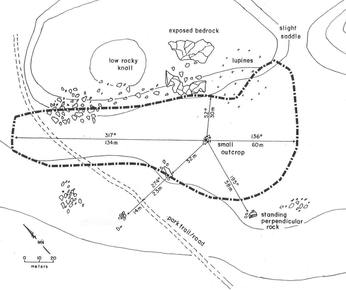
read and interpret: atlas maps, OS maps, base maps&sketch maps, town-centre maps&plans - 4—SKETCH MAP- illustrate location of case study, simple scale, + fit to your needs, easy to understand, - inaccuracies, lack of detail
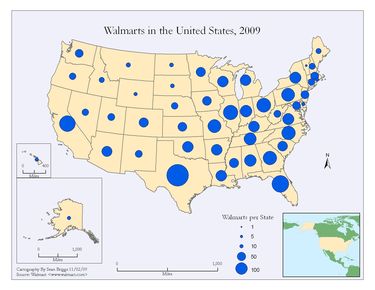
- 5—PROPORTIONAL SYMBOL MAP- include symbols proportional in size/area to their value, + visual representation, clear, easy to understand - range rather than specific value, difficult to measure certain shapes
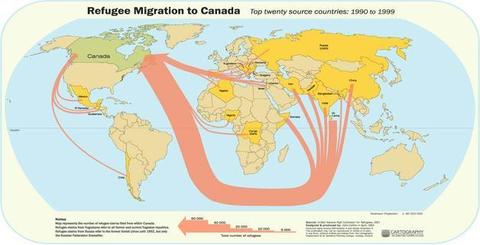
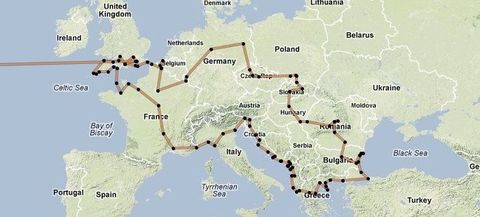
- 6—FLOW LINE MAP- represent volume of movement from place to place, line:quantity, along actual route, + clear visual representation - may look overcrowded if too many lines
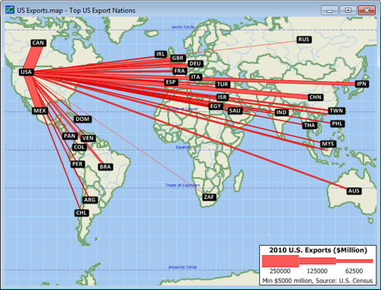
- 7—DESIRE LINE MAP- represent volume of movement from place to place, line:quantity, directly from origin to destination (no account of route), + clear visual representation - may look overcrowded if too many lines
- 8—TRIP LINE- represent volume of movement from place to place, line:quantity, can be drawn to show regular trips (e.g. footfall of shoppers in town), + clear visual representation - may look overcrowded if too many lines
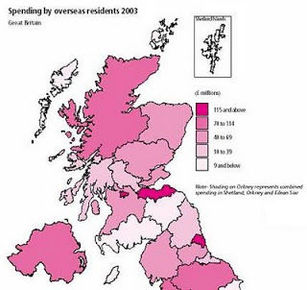
- 9—CHOROPLETH MAP- data values represented by density of shading, area in terms of value (e.g. pop density in UK), in classes, + colourful, draws attention, visual, - assumes whole area under one form of shading has same density with no variations, implies abrupt changes as you cross regional borders (not the case)
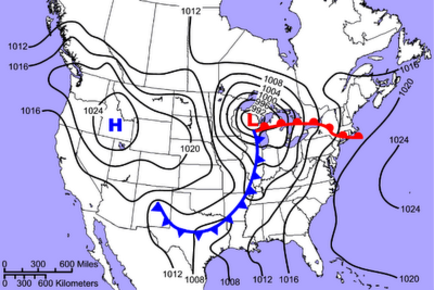
- 10—ISOLINE MAP- all points along a line have same value (e.g. pressure in weather and altitude on OS maps), + allows patterns of distribution to be seen (clear), - difficult to get continuous data along a line
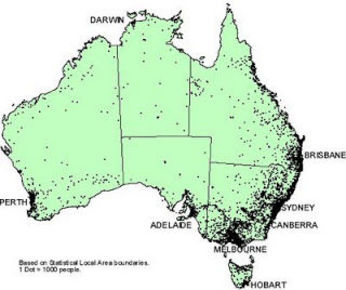
- 11—DOT MAP- spatial distribution represented by a number of dots equal to size (e.g. 1dot=10,000people), + clear, visual, - large numbers of dots are difficult to count, assumes false emptiness in areas below dot value, must be accompanying info about distribution or may be misleading
- 12GRAPHICAL SKILLS-> different types of representations of data (mainly graphs)
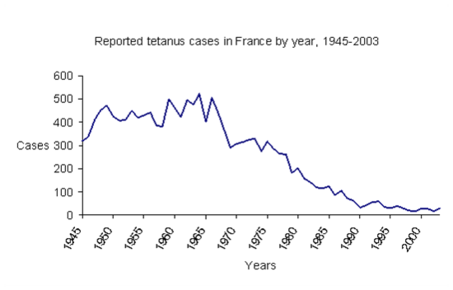
- 13—ARITHMETIC LINE GRAPHS- simple line graph- line represents actual values of measure on y axis
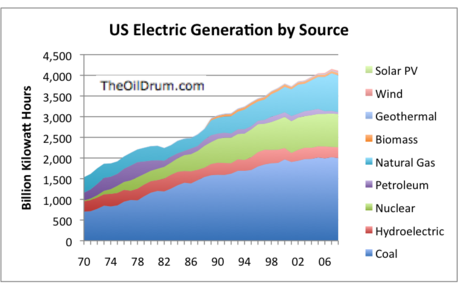
- 14—ARITHMETIC LINE GRAPHS- compound line graph- differences between the points on adjacent lines give actual values, areas between lines usually shaded
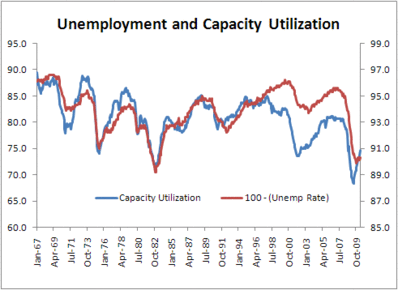
- 15—ARITHMETIC (LINE) GRAPHS- two sets of data- left hand y axis for one scale and right hand y axis for a different scale, + useful visual impression of the connection between two sets of data
- 16USING ARITHMETIC (LINE) GRAPHS~plot independent on x axis and dependent on y axis, avoid awkward scales, clearly label axes, use different colour/symbol if plotting more than one line
- 17ARITHMETIC LINE GRAPHS- pros and cons+ can compare multiple continuous data sets easily, + data inbetween points can be inferred through line of best fit, + can make predictions, - can only use continuous data, - only used to show data over time
- 18—LONG SECTIONS & CROSS-SECTIONS- used in river studies, construct line graphs showing height (y axis) but with distance on the x axis, + useful for describing and comparing land shape, - difficult to select smaller scale without inaccuracies
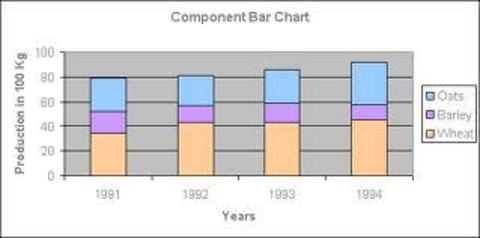
- 19—BAR GRAPHS- height is proportional to value, verticala scale is absolute data (discrete), can be SIMPLE, COMPARATIVE or COMPOUND, + show relative magnitudes effectively, +could show positive and negative values, + easy to understand, - categories can be re-ordered to emphasize certain effects (biased), -only discrete data
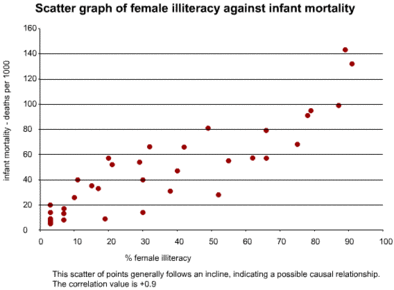
- 20—SCATTERGRAPHS- investigate relationship between two sets of data, best-fit line can be added, bottom left to top right= positive correlation top left to bottom right= negative correlation, points away from trend line known as residuals (anomalies) + useful in identifying patterns that could lead to further inquiry, + outliers could be investigated, + shows trend, - correlation could emerge when a relationship is just coincidental- all data must be continuous, - hard to visualise results in large data sets
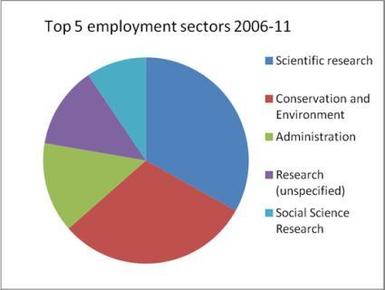
- 21—PIE CHARTS- divided into segments according to share of total value, + visually effective, - difficult to assess percentages or make comparisons when many small segments, - needs a key, -no exact numerical data, -best for 3-7 categories, -total is unknown
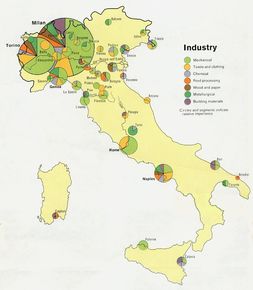
- 22—PROPORTIONAL DIVIDED CIRCLES (lots of pie charts)- no. of pie charts drawn proportionally together... use formula r= √V/π, V= value you want total pie chart to represent, r= radius of pi chart, (π=3.142), draw a circle radius r on graph paper, must state scale area represents value x units of data= 1 square unit on the graph paper
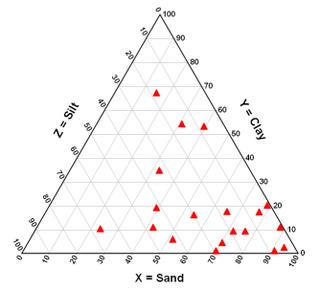
- 23—TRIANGULAR GRAPH- plotted on special paper (equilateral triangle), + varying proportiong and their relative importance can be seen, + can see the dominant variable of the three, +clusters sometimes emerge allowing classification, - only possible to use it for a whole figure broken into three components as percentages, cannot be used for absolute data or for figures not broken down into three components
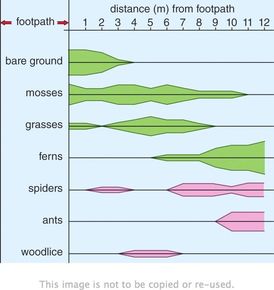
- 24—KITE DIAGRAMS- show changes over distance, particularly in vegetation, one axis is distance, the other the individual plant species, width of kite represents a single species, + width of kite enables visual comparisons to be made of the distribution of vegetation at any point in the section
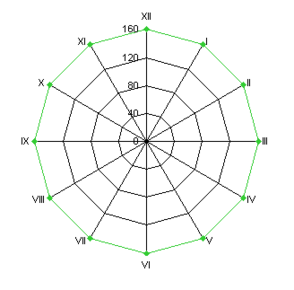
- 25—RADIAL DIAGRAMS- circumference represents orientations (compass directions) or a recurring feature e.g. a time period of 24 hours or an annual cycle of activity +can be used to plot traffic flows ore pedestrian flows over a period of time during the day, +can compare multiple sets of data, +useful when one variable is a directional feature, -hard to spot anomalies, -hard to make a suitable scale,
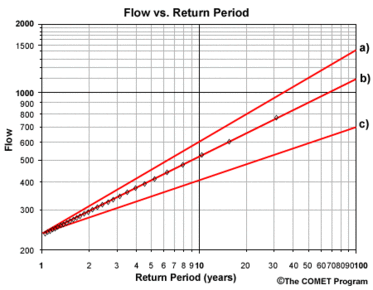
- 26—LOGARITHMIC GRAPHS- drawn in same way as arithmetic graphs but scales are divided into a no. of cycles, each representing a tenfold increase in the range of values i.e. 1 to 10 then 10 to 100 then 100 to 1000 etc., starting point depends on data range, graph paper can be fully logarithmic or semi-logarithmic (one axis on log scale and other is linear), straight line if rate of change increasing at constant proportional rate (e.g. doubling each time period), + good for showing rates of change (steeper line, faster rate), + allow a wide range of data to be displayed, -cannot plot +ve and -ve values on the same graph, -never base line of 0
- 27—DISPERSION GRAPHS- used to display the main patterns in data distribution, graph show each value as individual point against a vertical scale, shows range of data and distribution within the range +enables comparison of the degree of bunching of 2 sets of data, +shows spread from mean, +anomalies shown, -works better with lots of data, -standard deviation can be manipulated (biased)
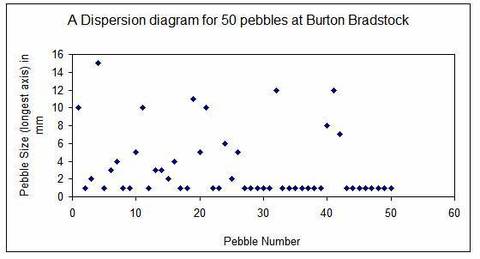
- 28STATISTICAL SKILLS->measures of central tendency (averages & distribution) -> measures of dispersion or variability -> box & whisker plots -> histograms ->correlation (Spearman rank correlation coefficient)
- 29—MEASURES OF CENTRAL TENDENCY- Arithmetic mean= (Σx)/n, Mode= most frequent value, median= (n+1)/2 (middle number), distribution of the data set= +ve or -ve skew (bigger difference in mean, mode, median -> bigger skew...+ve or -ve)
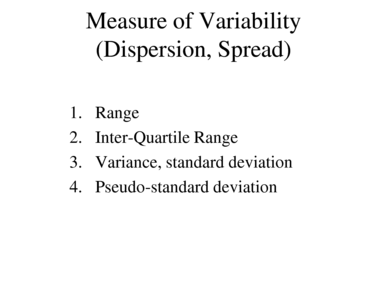
- 30—MEASURES OF DISPERSION OR VARIABILITY- range= highest value- lowest value, inter-quartile range= Q3-Q1= [3(n+1)/4]-[(n+1)/4], Standard deviation= √[(∑x^2 )/n)-((∑x)/n)^2]
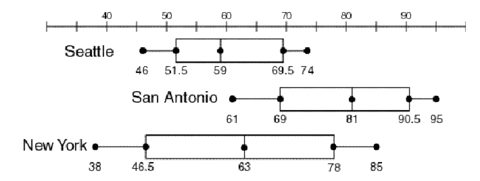
- 31—BOX-AND-WHISKER PLOTS- need median, Q1, Q3, highest value, lowest value and outliers. The box contains 50% of the data and is the IQR
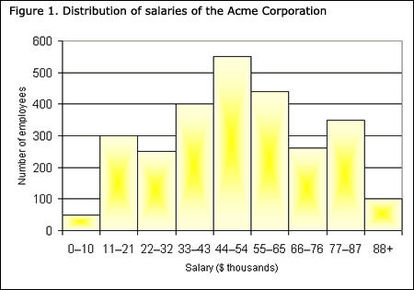
- 32—HISTOGRAMS- used to show frequency distribution of data, use bars for frequency, data is classed/grouped, +used to simplify and clarify data that are easier to analyse when in groups, +large amounts of data can be reduced to manageable proportions, +makes it possible to see trends, -dificult to group the data (establish no. of classes and class interval)
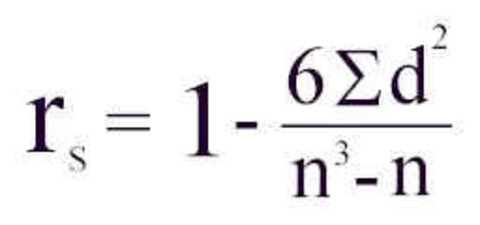
- 33—SPEARMAN RANK CORRELATION COEFFICIENT (measuring correlation)- comparison between two sets of data to see if there is a relationship between them, measures degree to which there is correlation, raw figures are ranked, d=difference in ranking between the two sets of paired data, n= no. of sets of paired data, Method~ 1. rank both sets highest to lowest (highest=1, 2nd highest=2 etc.)(if 2+ the same, find average rank and the next value will be the one after), 2. calculate difference in rank for each set of paired data (d), 3. put d and n in formula, 4. 1=perfecet +ve correlation, -1= perfect -ve correlation, 0= no correlation
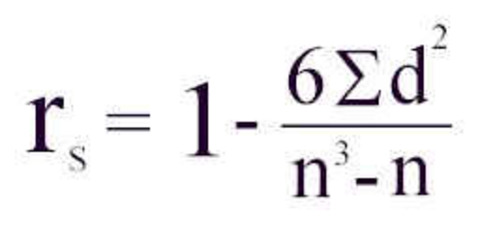
- 34—SPEARMAN'S RANK CONTINUED- warnings~ need between 10 and 30 data sets since unreliable if lower and too complex if higher, relationship may have occurred by chance->must assess statistical SIGNIFICANCE through tables- >5%=insignificant, <5%=significant=meaningful, <1% occurring by chance= very significant, if coefficient>table value ~ significant at that level
- 35—ICT SKILLS- ~use remotely sensed data (photos including satellite), ~use databases (e.g. censuses), ~use Geographical information systems (GIS), ~present text, graphical and cartographic images using ICT

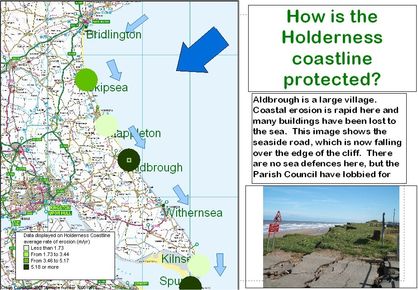
- 36—GIS (a mapping tool)- used by environmental planners, gov. departments, public utility companies & commercial companies. Ability to store, retrieve, manipulate & analyse wide range of spatially related data. Can: help with ?ing and understanding data, enable multiple interrogation of complex data, illustrate difficult concepts in dynamic & visual way, use 3D, help for modelling and decision making
Informações
- Descrição
- A Levels Geography FlashCards sobre AS level geography- Geographical Skills, criado por beth2384 em 26-04-2014.
- Criado por
- beth2384 · abr 2014
- Atualizado
- 18 jan 2017
- Visualizações
- 4.173
- Tags
- Avaliação