
Graphs
Slides do conjunto (6)
-
- This presentation will focus on the different steps in takes to make a good graph
-
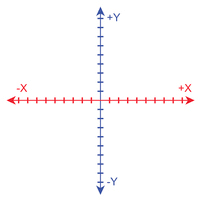
- Plural of Axis - Axes
- Y axis - Vertical
- X axis - Horizontal
- Legenda: Axes featuring Y, X, -Y, and -X
-
Step 2: Label your axes and title the graph
- Always label with units that are CONSISTENT
- X = independent variable
- Y = dependent variable
- Title should go as follows: DV vs. IV
- Remember:
- D - Dependent
- R - Responding
- Y - Y axis
- M - Manipulated
- I - Independent
- X - X axis
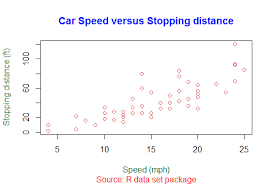
- Legenda: A correctly labeled graph
-
Step 3: Identify the range for your X & Y
- How to identify range:
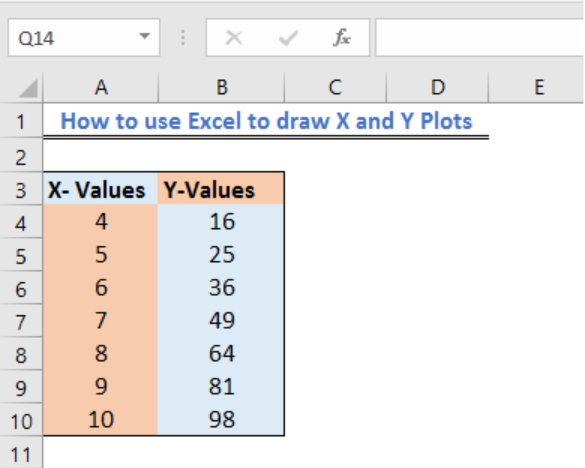
- Look at the highest and lowest point from each variable ------>
- X - 4&10 Y- 16&98
- Subtract lowest from highest
- 10-4 and 98-16
- Then you get your range!
- X- 6 and Y- 82
-
Step 4: Identify units for your variables
- Take your range and divide it by the number of lines on your axes.
- Ex - Say your range is 20 but you only have 10 lines, you would do 20/10 and get 2
- 2 would be your unit of increasement
- Say you get a decimal - for example 1.6666- you would round UP to 2.
- Always round up
- Repeat for all axes
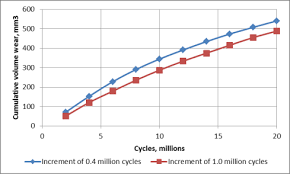
- Legenda: Correctly incremented graph
-
- Start with first point of data
- |
- -----------> Ex) Time: 1 Distance: 15
- Plot data where two lines meet
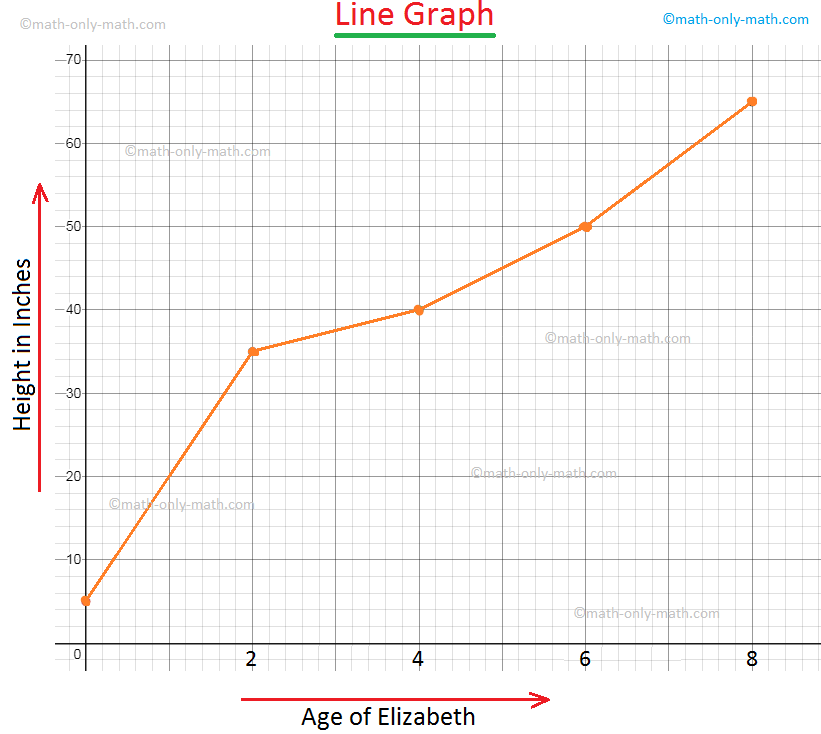
- Legenda: Correctly plotted graph
Informações
- Descrição
- A slide show showing all the steps on how to make a detailed and correct graph
- Criado por
- Avery Horan
- Visualizações
- 17
- Tags
- Avaliação