
Quiz
Statistical Methods Midterm II
Create a free account to finish this quiz
Save your progress and see your final score.
Already have an account? Sign in
Questions in this quiz (70)
1In a normally distributed data set, what percentage of data are contained within 2 standard deviations?
- A33%
- B95%
- C5%
- D100%
- E68%
2Describe the distribution below
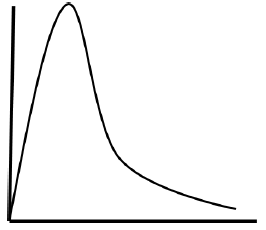
- APositive (playtykurtic) skewed distribution
- BNegative (leptokurtic) skewed distribution
- CGaussian distribution
- DNegative (platykurtic) skewed distribution
- EPositive (leptokurtic) skewed distribution
3Researchers in British Columbia have been tracking returning stocks of salmon to their natal lakes and streams. A recent study has found that the returning stocks are comprised of nearly twice the number of females as males. It had been proposed that this skewed sex ratio is the result of the warming of the lakes and streams in recent years. What would the null hypothesis be?
- AThe warming of lakes and rivers effect the sex ratio of returning salmon stocks
- BThe sex ratio of returning stocks will be 2:1
- CThe warming of the lakes and rivers in recent years has no effect on fish stocks
- DThe warming of lakes and rivers has no effect on the sex ratio of returning salmon stocks
- EThere is a statistically significant effect of fish sex on lake warming
4Male field crickets call to attract potential mates by rubbing their fore-wings together to produce sounds (chirps). Females are attracted to males that chirp most often (high time spent calling), loudest (high sound pressure level), and with low pitch (low carrier frequencies). Body size is hypothesized to impact these aforementioned signaling traits. You spend months quantifying how body size influences time spent calling, sound pressure level, and carrier frequency using the fall field cricket as your model organism. The following table lists your results (three different regressions) for how body size influences male chirping behaviour. Based on the table, which of your null hypotheses could you reject? Note: alpha = 0.05

- ATime Spent Calling
- BTime Spent Calling and Carrier Frequency
- CSound Pressure Level
- DCarrier Frequency
- ESound Pressure Level and Time Spent Calling
5Amphibians have been shown to be an indicator species within lakes and rivers. They are therefore used to monitor the quality of the lakes and rivers they are present in. You wish to determine whether the number of amphibians counted over a 10 km stretch of the Rideau River differs from the number counted over a 10 km stretch of the Ottawa River. Which statistical test should you run based on the information gathered?

- ACorrelation
- BChi-square test of Independence
- Ct-Test
- DChi-square test for Goodness of Fit
- EExact test for Goodness of Fit
6Monsanto has been working on several new types of fertilizer all claiming to increase the yield of wheat crops. You want to know whether the three fertilizer types have different yields of wheat crops (measured in metric tonnes). Based on the table below, which type of statistical test should you run?

- AChi-Square test for Goodness of Fit
- BLinear Regression
- CChi-Square test of Independence
- Dt-Test
- EANOVA
7Based on the figure below, how accurate could you be if you were to infer how much an adult male wolf spider will signal based on its age? (note: the x axis represents age, and the y axis represents time spent signaling)
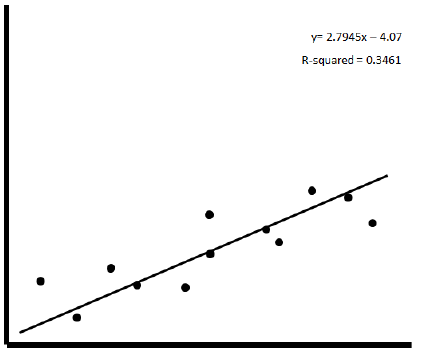
- AAny inference made would only have 65.39% accuracy.
- BAny inference made would only have 34.61% accuracy.
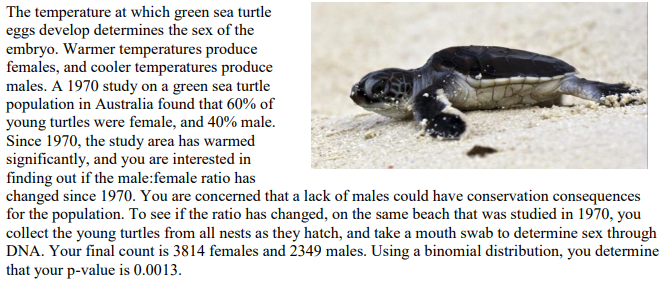
- CAny inference made would only have 2.79% accuracy.
- DAny inference made would only have 0.3461% accuracy.
- EAny inference made would only have 4.07% accuracy.
8Big Rideau Hospital advertises they have the shortest wait-list for knee surgeries in the province of Ontario, claiming an average (mean) wait time of only 3.5 months (105 days). You randomly sample ten post-surgery patients of the hospital to determine their wait time prior to surgery, and you collect the following data on number of days they spent waiting prior to surgery: 72, 80, 82, 82, 97, 100, 107, 111, 120, 200 days. If you calculated the mean by summing these numbers and then dividing by 10 you would see that the mean wait time is exactly 105 days, suggesting that Big Rideau’s claim is supported. However, all but one of the following claims associated with the reported data are false. Which claim is true?
- AThe distribution is positively skewed
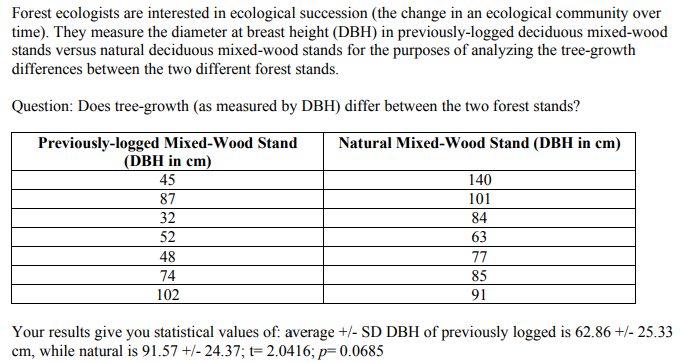
- BThe median is: [(107 + 111) / 2] = 109
- CThe distribution is Gaussian
- DThe mode is greater than the mean
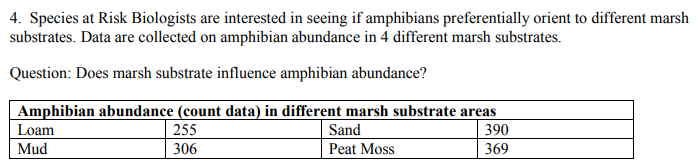
- EThe range is 172
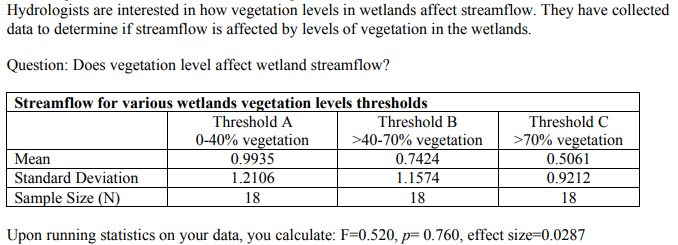
9Which of the following statements is true?
- AThe type of error bar chosen changes the data’s variance
- BThe greater the kurtosis of a data distribution, the greater the spread of the distribution
- CBox-and-Whisker plots do not show the distribution of data
- DScatter plots do not provide any visualization of the potential mean
- EA dataset with a normal distribution and one with a skewed distribution can share the same mean and standard deviation
10After conducting a statistical test, you calculate a probability of 0.04. Given an alpha value of 0.05, you
- Ahave made a type I error
- Baccept the null hypothesis
- Ccan reject the null hypothesis
- Dhave made a type II error
- Ecan regard the relationship or difference as statistically non-significant
11A statistical test is performed to screen for malaria based on a small sample of subjects and does not produce a statistically significant result even if the true number of subjects with malaria differs from the null value. This type of result is known as:
- Aa type II error
- Bthe alpha level of the test
- Ca small effect size
- Da type I error
- Ethe power of the study
12You are performing a chi-squared test on the differences between amphibian abundances in marsh substrate areas. You obtain the following results (count data). To run a chi-square analysis you need to compare your OBSERVED data (below) with the data that you EXPECTED. Given this, you need to calculate your expected values. Your expected values depend on the null hypothesis, and the null hypothesis is that amphibian abundance does not depend on marsh substrate. Given this, what are the expected values in your chi-square test?

- AYou would calculate your expected values based on using p = 0.5, as they are all assumed to be equal
- BYour expected values are all 100, as this is the average number of amphibians observed (75+92+120+113)/4
- CYour expected values are all 400, the sum of all amphibians observed (75+92+120+113)
- DThese data should not be analyzed with a chi-squared test because they are not nominal
- EYour expected values are all 0.25, as they are all assumed to be equal (1/4 = 0.25)
13Which of the following best describes the data distributions of the following figure?
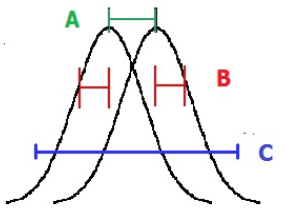
- AThe means of the two distributions are the same
- BA represents the variation between group means, B represents the variation within groups, and C represents the total variation across both groups
- CB shows larger variance than is shown in C
- DThe first distribution has a very different sample size from the second distribution
- EA, B, and C all show the same amount of variation
14Describe the correlation in the graph shown (P = 0.04).
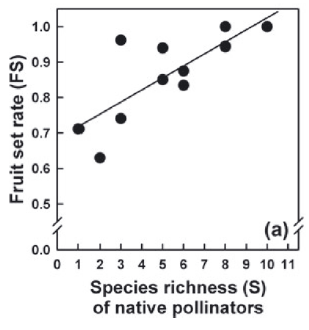
- AFruit set rates do not correlate with species richness of native pollinators
- BThe correlation between species richness of native pollinators and fruit set rates is nonlinear
- CThe correlation between species richness of native pollinators and fruit set rates is negative
- DFruit set rates drive variation in species richness of native pollinators
- EThe correlation between species richness of native pollinators and fruit set rates is positive
15A researcher is interested in examining the number of freshwater fish as a dependent variable, and the effects of habitat type (open water bed or reed bed) as factors (nominal variables). The researcher controls for the size of the water body (covariate). This experiment could utilize:
- AANOVA
- BChi-square test for Goodness of Fit
- Ct-Test
- DCorrelation
- EANCOVA
16You want to quantify the variation in body size between wolves living in Gatineau Parc. You catch 15 adult wolves and weigh them (kg). The different weights are: 29, 30, 31, 31, 34, 35, 36, 43, 44, 45, 46, 47, 65, 70, 79
Which statement is INCORRECT?- AThese data have a mode of 31
- BThese data have a positive skew
- CThese data are normally distributed
- DThe range of these data is 50
- EThese data have a median of 43
17Which of the following is TRUE regarding outliers?
- AScatterplots and mean +/- standard deviation plots are the most useful for identifying outliers.
- BOutliers are data points that lie an abnormal distance from other values in a random sample from a population. Scatterplots and boxplots are the most useful for identifying outliers.
- CScatterplots and boxplots are the most useful for identifying outliers.
- DOutliers are data points that lie an abnormal distance from other values in a random sample from a population.
- EOutliers are data points that lie an abnormal distance from other values in a random sample from a population. Scatterplots and mean +/- standard deviation plots are the most useful for identifying outliers.
18Which of the following about p values is FALSE?
- AP values are the probability of finding the observed results when the null hypothesis is true. P values provide inferences about our sample and how random it is.
- BP values provide inferences about our sample and how random it is.
- CWhen p < 0.05, we reject the null hypothesis because our results are not found to be significant
- DP values are the probability of finding the observed results when the null hypothesis is true.
- EWhen p < 0.05, we reject the null hypothesis because our results are not found to be significant. P values provide inferences about our sample and how random it is
19You are training crickets in radial arm mazes that have 6 arms so they can learn to find a food reward. You train one cricket on two separate occasions. What is the probability that the first arm the cricket enters both times is arm #4?
- A1/6
- B1/12
- C0.5
- D1/36
- E2/6
20Which of the following about probability is FALSE?
- AA probability of 0 means the event cannot happen
- BA probability of -1 means the event will happen
- CA probability of 0.5 means the event is equally likely to happen or not
- DProbability is used to quantify a prediction about future events
- EProbability ranges from 0 to 1
21You are interested in studying whether male grasshoppers become aggressive when fighting with or without an audience. Based on the table below, which statistical test would you run?

- AExact statistical test of goodness of fit
- BChi-square test of independence
- CANOVA
- DChi-square goodness of fit
- Et-Test
22You want to quantify whether the wing span of male and female chickadees differs. You collect data on 1200 individuals (600 males and 600 females). What types of data do you have, and which statistical test would you run to answer the question?
- AGiven that there are two nominal variables (one dependent and one independent), I would run a chi-square test of independence since I will be comparing proportions of the variables and there are more than 1000 data points collected
- BGiven that the dependent variable is continuous and the independent variable is nominal with only two values, I would run a student’s t-test for two samples
- CGiven that there is one nominal variable and one continuous variable with only two values, I would run a student’s t-test for two samples
- DGiven that both the dependent and independent variables are continuous, I would run a regression or a correlation.
- EGiven that the dependent variable is continuous with two or more values and the independent variable is nominal with only two values, I would run an analysis of variance (ANOVA)
23You run a study on the usefulness of the flu shot preventing the flu and receive an R2 value of -1.45. What can you conclude?
- AThe correlation between getting the flu and the flu shot is significant
- BThere was a negative relationship between receiving the flu shot and getting the flu
- CThere was a positive relationship between receiving the flu shot and getting the flu
- DThere is not enough information to answer this question
- ESomething went wrong in the statistical analyses
24What information can you glean from a histogram? As always, choose the best answer.
i. The distribution of the data
ii. The presence of any outliers
iii. The standard deviation
iv. The approximate location of the median value- Ai & iii
- Bi, ii, & iv
- Cii & iii
- Dii & iv
- Ei & ii
25Given a data set of mean = 45, median = 56 and mode = 74, what is the most likely
distribution?- ANegative skew
- BYou cannot tell from the provided information
- CPositive skew
- DGaussian
- EBimodal
26How are the data distributed; can you summarize the data using a graph of mean and
standard deviation?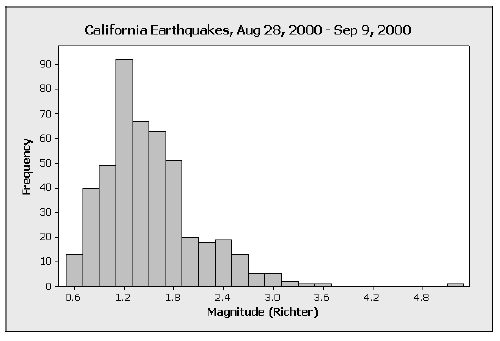
- ANegative skew; CAN be summarized using mean and standard deviation.
- BGaussian (normal) distribution; CAN be summarized using mean and standard deviation.
- CPositive skew; can NOT be summarized using mean and standard deviation.
- DGaussian (normal) distribution if the outlier is removed; CAN be summarized using mean and standard deviation.
- ENegative skew; can NOT be summarized using mean and standard deviation.
27There appears to an outlier in the above graph; what should you do about it?
- ARemove the outlier as your statistical analyses will not function properly if it is left in the data set.
- BNothing; having only one outlier will not have a major effect on your analyses.
- CUse the median in place of the mean when running your t-tests
- DRemove the outlier as it is likely an error and therefore shouldn’t be included in your analyses.
- ERe-examine your raw data to ensure that it is not a typo or biologically impossible.
28White-crowned sparrows have two colour morphs: they can either have bright white feathers (=white morph) or dull tan feathers (=tan morph). You think that there might be a relationship between what colour the bird is and their diet when they were in the nest. Diet could also affect their body size. You hypothesize that there is a relationship between colour morph and body size. You use a statistical test to investigate whether there is a difference between the two groups in their body size, and get a p-value of 0.46. What is your null hypothesis? What statistical test do you use? Should you reject or accept your null hypothesis based on your p-value?
- AThere is no difference in body size between white and tan morph sparrows; t-test; accept.
- BThere is no difference in body size between white and tan morph sparrows; t-test; reject.
- CThere is a difference in body size between white and tan morph sparrows; ANOVA; accept.
- DThere is a difference in body size between white and tan morph sparrows; ANOVA; reject.
- EBody size differences drive colour differences in white and tan morph sparrows; t-test; accept.
29What does the p-value of 0.46 from the previous question mean?
- AThere is a 46% chance that there is a difference between body size in white and tan morph sparrows
- BColour morph differences explain 46% of the variation in body size in sparrows
- CThere is a 46% chance that there is no difference between body size in white and tan morph sparrows.
- DThere is a 46% chance of observing your results, or more extreme results
- EColour morph differences explain 64% of the variation in body size
30Given this graph which shows the probability of getting X number of heads out of 10 tosses when you use a 2 sided coin (heads and tails), which of the following values is closest to the p-value for 7 heads out of 10 tosses?
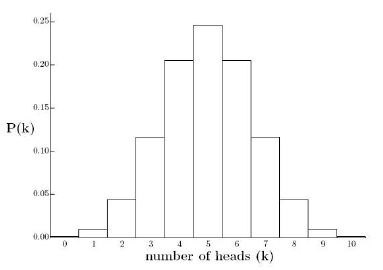
- A<0.0001
- B0.70
- C0.05
- D0.10
- E0.60
31Read this excerpt from Science News, and then answer the question: What null hypothesis would have been tested in this study?
"Reconstructing the history of the greater bamboo lemur (Prolemur simus) in Madagascar suggests that drier areas over thousands of years already have lost their populations. As the region dries further due to climate change and the bad-bamboo months in the last holdouts lengthen, remaining populations of these critically endangered lemurs might go hungry and fade away too, an international research team warns online October 26 in Current Biology.
Other animals, even another lemur species, will eat lots of bamboo shoots and leaves. But the greater bamboo lemur is the only mammal besides the giant panda that sticks with bamboo during the dry season. That’s when the plants stop sprouting and offer only culm, the tough, old, yellowing stems poor in nutrients. Culm hasn’t reached the hard stage of bamboo that’s used as a building material. “Nobody wants to eat that,” says study coauthor Alistair Evans, an evolutionary morphologist at Monash University in Melbourne, Australia."- AClimate conditions do not effect bamboo growth.
- BThere is no relationship between climate and the length of time per year the bamboo sprouts.
- CThere is no difference in diet between the bamboo lemur and other lemur species.
- DBamboo lemur populations do not effect climate change
- EThere is no relationship between how dry an area is and whether there is a bamboo lemur population.
32You have completed the biggest experiment of your master’s thesis only to find that your p-value is 0.06. You normally consider alpha 0.05 as significant, but you recently read a paper that used a significance level of alpha <0.10. Should you change your alpha significance level so that your p-value is significant?
- ANo, changing your alpha value would require you to re-run your analysis and you might get an even less significant p-value.
- BYes, you are certain that the relationship you tested is real, and although you may increase the chances of a type 2 error, you will decrease the chances of a type 1 error.
- CYes, the other study used alpha
- DYou should re-run your analysis, obviously you have mistakenly flipped your independent and dependent variables, flip them around the other way and you will get a significant p value. Alpha values have nothing to do with your finding.
- ENo, you should set your alpha level BEFORE you run your analysis; changing alpha to 0.10 will increase your chances of a type 1 error.
33Your study has found that on average, hummingbirds without access to a feeder visit 0.33 more flowers per minute than hummingbirds that have access to a feeder. What does this difference (0.33) mean? What effect does it have on whether your p-value is significant?
- A0.33 is the effect size of the difference between treatments; it is independent of significance.
- B0.33 is the p-value; because it is greater than 0.05 there is no significant difference between treatments.
- C0.33 is the alpha value
- D0.33 is the effect size of the difference between treatments; you would need to know the sample size in order to know how much influence the effect size has on the p-value.
- E0.33 is the effect size of the difference between treatments; larger effect sizes make the p-value more likely to be significant.
34When reporting the results of an analysis, what values should be given in order for others to interpret your findings?
i. the effect size
ii. the degrees of freedom or the sample size
iii. the p-value
iv. the confidence intervals- Ai, ii, & iii
- Bi & iii
- Ci & ii
- Di, ii, iii & iv
- Eii & iii
35Which population(s) has/have the highest central tendency?
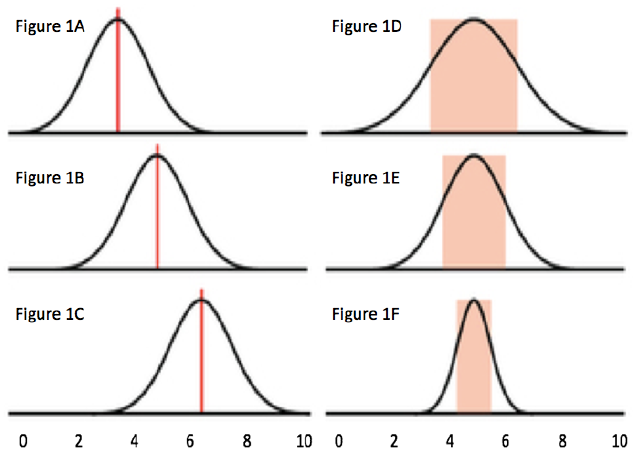
- AThe populations shown in Figures 1B, 1D, 1E and 1F all have what look to be the same central tendency
- BThe population shown in Figure 1F
- CThe population shown in Figure 1A
- DThe population shown in Figure 1C
- EThe population shown in Figure 1D
36Which population(s) has/have the lowest variance (assuming equal sample sizes across Figures 1A through 1F)?
- AThe population shown in Figure 1C
- BThe population shown in Figure 1F
- CThe populations shown in Figures 1A, 1B, 1C & 1E have what looks to be the same variance
- DThe population shown in Figure 1A
- EThe population shown in Figure 1D
37You decide to test whether pairs of the fish populations are significantly different from each other using a series of two-sample t-tests. Based on comparing the following pairs of populations, which pair do you think will have the HIGHEST P-VALUE? Take your time on this one. It is a bit tricky.
- AThe two populations shown in Figures 1A and 1B
- BThe two populations shown in Figures 1A and 1C
- CThe two populations shown in Figures 1B and 1E
- DThe two populations shown in Figures 1A and 1F
- EThe two populations shown in Figures 1B and 1C
38You decide to test the null hypothesis that the populations shown in Figures 1D, 1E, and 1F do not significantly differ using an ANOVA. Your ANOVA results reveal that these distributions are NOT significantly different from each other. Based on the evidence available, what is the best explanation for why you could not reject your null hypothesis? Again, be careful with this one, it is a bit tricky. Take your time and think through the logic.
- AThe F statistic was too large to be significant because the variance between the groups was large
- BThe F statistic was too large to be significant because both the variance between the groups was small and the variance within the groups was large
- CThe F statistic was too small to be significant because the variance within the groups was large
- DThe F statistic was too large to be significant because the variance within the groups was small
- EThe F statistic was too small to be significant because the variance between the groups was large
39Which of the following statements is FALSE?
- AThe dependent variable is continuous
- BAll of the distributions shown in Figures 1A through 1F appear Gaussian
- CThe assumptions of the t-test would be met if you were to test the null hypothesis that the standard length of fish from population D (shown in Figure 1D) does not differ from the standard length of the population E (shown in Figure 1F)
- DA histogram rank-orders continuous data
- EThe independent variable is categorical
40Which of the following sentences is the observation that led to your study?
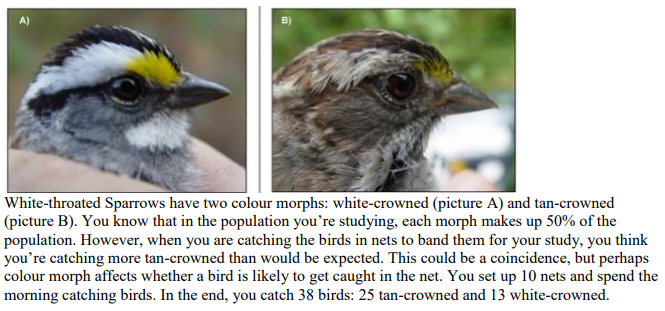
- AWhite-throated Sparrows have two colour morphs: white-crowned and tan-crowned.
- BIn the end, you catch 38 birds: 25 tan-crowned and 13 white-crowned.
- CWhen you are catching the birds in nets to band them for your study, you think you’re catching more tan-crowned than would be expected.
- DColour morph affects whether a bird is likely to get caught in the net.
41Which of the following is your null hypothesis?
- AA bird’s colour morph influences the likelihood that it will be caught in a net.
- BTan-crowned sparrows are more likely to be caught than white-crowned.
- CThere is no relationship between colour morph and whether a bird is caught in a net
- DThere is no difference between the proportion of tan-crowned and white-crowned colour morphs in the population.
42You calculate a p-value of 0.036 for the results you obtained. What does this p-value mean?
- AThere is a 3.6% chance that tan-crowned and white-crowned sparrows are equally likely to be caught, given your data.
- BThere is a 3.6% chance that the population contains 50% white-crowned and 50% tan-crowned morphs.
- CYou calculate a p-value of 0.036 for the results you obtained. What does this p-value mean?
- DThere is a 3.6% chance that that there is no relationship between colour morph and whether a bird gets caught.
43Given your p-value of 0.036, what are the chances that you have rejected the null hypothesis due to a Type 1 error?
- A0.036%
- B0.36%
- C3.6%
- D36%
44How could you improve the validity of your study?
i.Catch birds over a longer period of time.
ii.Do a DNA analysis on all the birds you catch.
iii.Catch birds at multiple different locations.
iv.Change the types of nets used for catching birds.- Ai, ii & iii
- Bii & iii
- Ci & iii
- DAll of the above
45What is your research hypothesis for this project?
- AThere is a difference in the percentage of males and the percentage of females.
- BThere is a difference in the percentages of males and females found in 1970 and in your study.
- CThere is no difference between the percentage of male and the percentage of females.
- DThere is no difference in the percentages of males and females in 1970 and in your study.
46Which factor could affect the independence of your samples?
- AThe turtles all hatched within one week of each other.
- BMultiple turtles hatched from each nest.
- CThe turtles are all the same species.
- DThe turtles are all the same age.
47The organization funding your study says it’s too expensive to test so many mouth swabs, and suggest that you only swab turtles from one area of the beach on one night. What problem could arise from this method?
- ATo have valid results, you must always test the entire population you’re interested in
- BYour results would likely not be normally distributed, increasing your chances of a false positive error.
- CThe turtles who were swabbed might not be representative of the entire population.
- DThe sample size would only be approximately 500, which is too low for any statistics to be used.
48Given your p-value, have you proven your research hypothesis? Why or why not?
- ANo, you can never prove your research hypothesis, but you can reject the null hypothesis and find support for your research hypothesis.
- BNo, you do not have enough evidence to formally reject the null hypothesis, but it’s likely not true.
- CYes, when the p-value is > 0.05
- DYes, your p-value is < 0.05
49You perform the same study on another beach, which is much smaller and has very few turtles. On this small beach, you get a ratio of 7:3 females to males (compared to 6.1:3.9 at the larger beach), but your p-value is 0.08 (statistically non-significant). Why might this be?
- AWhen you have small sample sizes you should always use a significance level of 0.10, meaning this result is actually significant.
- BP-values always decrease when your sample size decreases.
- CP-values are affected by sample size as well as effect size.
- DP-values increase with increasing effect size.
50What is the median DBH for each wood stand
- A62.86 and 91.57
- B7 and 7
- C52 and 85
- D70 and 77
51What is the most appropriate statistical test to use to analyze your data?
- ATwo-sample T Test
- BExact Test of Goodness of Fit
- CChi-Square Test of Goodness of Fit
- DStudent's T Test
52What is your conclusion surrounding your null hypothesis?
- AWe reject the null hypothesis, because the p-value is greater than our standard alpha
- BWe reject the research hypothesis, because the p-value is greater than our standard alpha
- CWe fail to reject the null hypothesis, because the p-value is greater than our standard alpha
- DWe fail to reject the research hypothesis, because the p-value is less than our standard alpha
53What is the most appropriate statistical test to use to analyze your data?
- AChi-square Test of Goodness of Fit
- BChi-Square Test of Independence
- CAnalysis of Variance (ANOVA)
- DExact Test of Goodness of Fit
54What is the most appropriate statistical test to use to analyze your data?
- AAnalysis of Variance (ANOVA)
- BChi-Square Test of Goodness of Fit
- CExact Test of Goodness of Fit
- DT-Test
55How would you classify the variables in this study?
- AStreamflow is a categorical variable; vegetation level thresholds is a continuous variable
- BStreamflow is a continuous variable; vegetation level thresholds is a continuous variable
- CStreamflow is a categorical variable; vegetation level thresholds is a categorical variable
- DStreamflow is a continuous variable; vegetation level thresholds is a categorical variable
56What can you conclude about the effect size from this study?
- AThe effect size tells us we can accept the null hypothesis
- BThere is a small effect size
- CThere is a significant effect size, as the effect size value is less than our alpha of 0.05
- DThere is a smaller chance that population means will be equal, based on the value
57What is the most appropriate statistical test to use to analyze your data?
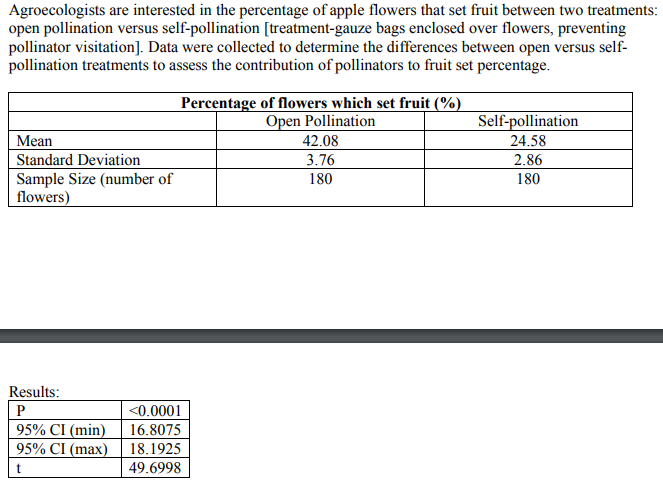
- ATwo-sample T-Test
- BChi-Square Test of Goodness of Fit
- CExact Test of Goodness of Fi
- DStudent's T-Test
58What can you conclude about the two pollination treatments based on the p-value?
- AAs the p value is greater than 0.0001, we fail to reject the null hypothesis. There is no statistical difference between the two pollination treatments.
- BAs the p value is less than 0.0001, we have proven that there is a difference between the two pollination treatments and can therefore conclude that our results are significant.
- CAs the p-value is less than 0.05, we reject the null hypothesis. There is a statistically significant difference between the two pollination treatments.
- DAs the p value is less than 0.0001, we fail to reject the null hypothesis. Our results are not statistically significant, so we should change our alpha.
59What is the most appropriate statistical test for the described data-set and question?
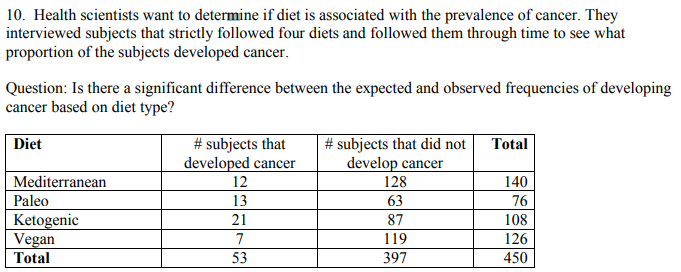
- AStudent's T-Test
- BExact Test of Goodness of Fit
- CChi-Square Test of Goodness of Fit
- DAnalysis of Variance (ANOVA)
60Sonar transmissions are thought to interfere with orcas’ ability to hunt because they may affect the whales’ echolocation abilities. The sonar may also disrupt whale communication, which is essential for group hunting. Scientists moved a boat using sonar to different distances away from each pod of
whales, and measured the percentage of time the pod spent hunting at each distance. They measured 18 pods containing 129 individuals. For each km further away the boat using sonar was, the whales spent 5% more time hunting. The r2 was calculated to be 0.62. The scientists concluded that there was a 4.7% chance that these results were due to chance alone. Use this information for the next four
questions. What is the most appropriate test to analyze these data?- ARegression
- BAnalysis of Variance (ANOVA)
- CCorrelation
- DAnalysis of Covariance (ANCOVA)
61Sonar transmissions are thought to interfere with orcas’ ability to hunt because they may affect the whales’ echolocation abilities. The sonar may also disrupt whale communication, which is essential for group hunting. Scientists moved a boat using sonar to different distances away from each pod of whales, and measured the percentage of time the pod spent hunting at each distance. They measured 18 pods containing 129 individuals. For each km further away the boat using sonar was, the whales spent 5% more time hunting. The r2 was calculated to be 0.62. The scientists concluded that there was a 4.7% chance that these results were due to chance alone. What does the value 4.7 in the paragraph above represent?
- AThe effect size (4.7)
- BThe p-value (0.047) and the chance that the result is due to a type 1 error (4.7%)
- CThe p-value (0.047)
- DThe chance that the result is due to a type 2 error (4.7%)
62Sonar transmissions are thought to interfere with orcas’ ability to hunt because they may affect the whales’ echolocation abilities. The sonar may also disrupt whale communication, which is essential for group hunting. Scientists moved a boat using sonar to different distances away from each pod of whales, and measured the percentage of time the pod spent hunting at each distance. They measured 18 pods containing 129 individuals. For each km further away the boat using sonar was, the whales spent 5% more time hunting. The r2 was calculated to be 0.62. The scientists concluded that there was a 4.7% chance that these results were due to chance alone.
What does the R-squared value (r2, coefficient of determination) tell you?- AThe R-squared value tells you only if there is a negative or positive relationship between the independent and dependent variables.
- BThe R-squared value tells you how accurate and precise your data are distributed around the mean.
- CThe R-squared value tells you how much of the variance in the dependent variable can be accounted for by the independent variable.
- DThe R-squared value tells you if there is a significant difference between the independent and dependent variables.
63Sonar transmissions are thought to interfere with orcas’ ability to hunt because they may affect the whales’ echolocation abilities. The sonar may also disrupt whale communication, which is essential for group hunting. Scientists moved a boat using sonar to different distances away from each pod of whales, and measured the percentage of time the pod spent hunting at each distance. They measured 18 pods containing 129 individuals. For each km further away the boat using sonar was, the whales spent 5% more time hunting. The r2 was calculated to be 0.62. The scientists concluded that there was a 4.7% chance that these results were due to chance alone.
What potential error is there in the above study?- AInstead of considering how far the sonar boat was away as a continuous variable, they should have lumped it into categories such as near/intermediate/far, so they could use a more powerful statistical test.
- BThe scientists took measurements with the sonar boat at multiple different distances for each pod. These measurements are not independent and if not accounted for, are an example of pseudoreplication.
- CThey should have measured each whale individually so that they had a higher sample size, making them more likely to have a significant answer.
- DThey should have used an alpha level of 0.10 to correct for their small sample size.
64
You want to determine whether the lake of origin (Pennask Lake, Blackwater Lake, or Star Lake) affects the size of steelhead trout (as measured by total length in cm). What is the most appropriate test to analyze these data?- ARegression
- BAnalysis of Covariance (ANCOVA)
- CAnalysis of Variance (ANOVA)
- DStudent’s T-Test
65Suppose your p-value for question 5 is .052. What will our conclusion be at alpha levels of .10, .05, and .01? (Ho denotes your null hypothesis)
- AWe will reject Ho at alpha=.10, but not at alpha=.05 or alpha=.01
- BWe will reject Ho at alpha=.10, .05, or .01
- CWe will not reject Ho at alpha=.10, .05, or .01
- DWe will reject Ho at alpha=.10 or .05, but not at alpha=.01
66Rank order the following scatterplots by their correlation coefficients (r) from -1 (perfect negative correlation) to +1 (perfect positive correlation).
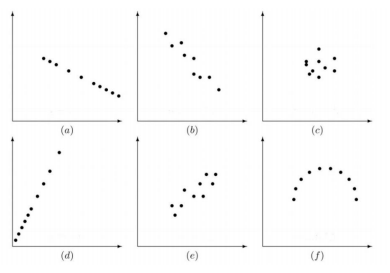
- Ab, a, f, c, d, e
- Bb, a, c, f, e, d
- Ca, b, c, d, e, f
- Da, b, f, c, e, d
67You are given the following figure of a linear regression of the relationship between native bee pollination and land use. The straight line represents the line of best fit through the data. The dashed line is the 95% confidence interval for the regression. Which of the following statements is most likely to be true?
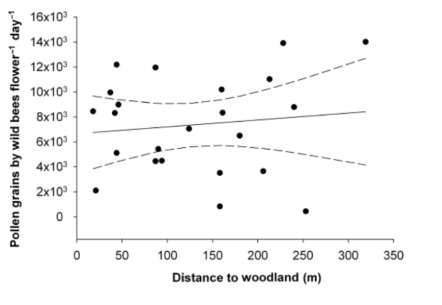
- AThe r-squared value is small (less than 0.05)
- BThe effect size is large (correlation coefficient of greater than 0.8)
- CThe p-value is small (less than 0.05)
- DThe degrees of freedom are too large (more than 50)
68To determine which chi-square test to use, what information do you need to know?
i.sample size
ii.degrees of freedom
iii.what the sample(s) are being compared to (hypothetical distribution vs another sample).
iv.Alpha level- AAll of the above (i-iv)
- Bi, iii, iv
- Ci & ii
- Di & iii
69For visualizing and describing data distributions, which of the following is false?
- AFor a positively skewed distribution the mode will be less than the median, which will be less than the mean (mode <median<mean).
- BA leptokurtic with have less kurtosis (pointyness) than a normal (mesokurtic) distribution.
- CFor a negatively skewed distribution the mean will be less than the median, which will be less than the mode (mean <median<mode).
- DA platykurtic distribution will have less kurtosis (pointyness) than a normal (mesokurtic) distribution.
70You are measuring the bill length of dunlins (a bird species) on the east and west coasts as you think they may differ in bill length due to different food sources. Given the following data, which answer best describes the data?
Western birds (mm): 45, 46, 47, 47, 48, 48, 48, 49, 49, 50, 51
Eastern birds (mm): 45, 45, 46, 46, 46, 46, 46, 47, 48, 49, 51- AThe western data are approximately normally distributed, while the eastern data have a slight positive skew; both populations have equal ranges.
- BThe western data have a positive skew, while the eastern data have a negative skew; western birds have a greater range.
- CBoth western and eastern data are approximately normally distributed; eastern birds have a greater range.
- DThe western data have a positive skew, while the eastern data have a negative skew; eastern birds have a greater range.
- EBoth western and eastern data are approximately normally distributed; both populations have equal ranges.
Information
- Description
- Quiz on Statistical Methods Midterm II, created by Yamma Noori on 19/11/2018.
- Author
- Yamma Noori
- Language
- English
- Views
- 4
- History
- Created on 19 Nov 2018 · updated on 20 Nov 2018
- Rating
- No ratings yet Rate this quiz