16386759
Description
Quiz by Jeffrey Piggott, updated more than 1 year ago
|
|
Created by Jeffrey Piggott
over 5 years ago
|
|
Question 1
Question
Which of the following is an example of a food chain?
Answer
-
A carnivore → herbivore → producer
-
B flower → fruit → seed
-
C grass → antelope → lion
-
D starch → maltose→ glucose
Question 2
Answer
-
A
-
B
-
C
-
D
Question 3
Question
The diagram shows the movements of water between oceans, land and the air.
The figures are based on an annual mean precipitation of 100 units.
What is the total of evaporation from the land and transpiration from plants at X?
Image:
Q3 (binary/octet-stream)
Answer
-
A 7
-
B 13
-
C 16
-
D 77
Question 4
Answer
-
A a food web
-
B non-cyclical energy flow
-
C the carbon cycle
-
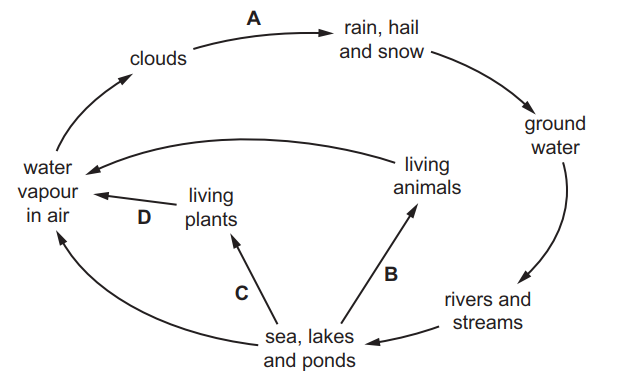
D the water cycle
Question 5
Question
The graph shows a population growth curve.
Which factors would cause region X on the graph to become steeper?
Answer
-
A decrease in predation, decrease in food supply
-
B increase in food supply, decrease in disease
-
C increase in food supply, increase in predation
-
D increase in predation, decrease in disease
Question 6
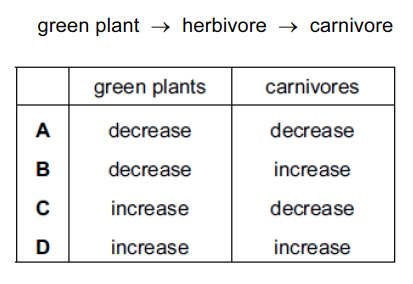
Question
The diagram shows a simple food chain.
If a disease causes the number of herbivores to decrease, what will be the effect on the numbers of green plants and carnivores?
Image:
Q2 (binary/octet-stream)
Answer
-
A
-
B
-
C
-
D
Question 7
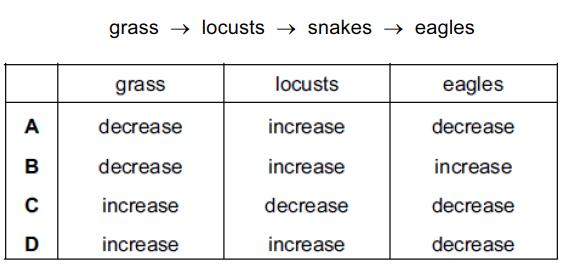
Question
In the food chain shown, the population of snakes is halved owing to a viral disease.
What effect does this have on the other members of the food chain?
Image:
Q3 (binary/octet-stream)
Answer
-
A
-
B
-
C
-
D
Question 8
Question
Which is an example of a population?
Answer
-
A all the animals and plants living in a pond
-
B all the mahogany trees growing in a forest
-
C all the people born in a country over a period of 100 years
-
D all the species of animals in Africa
Question 9
Question
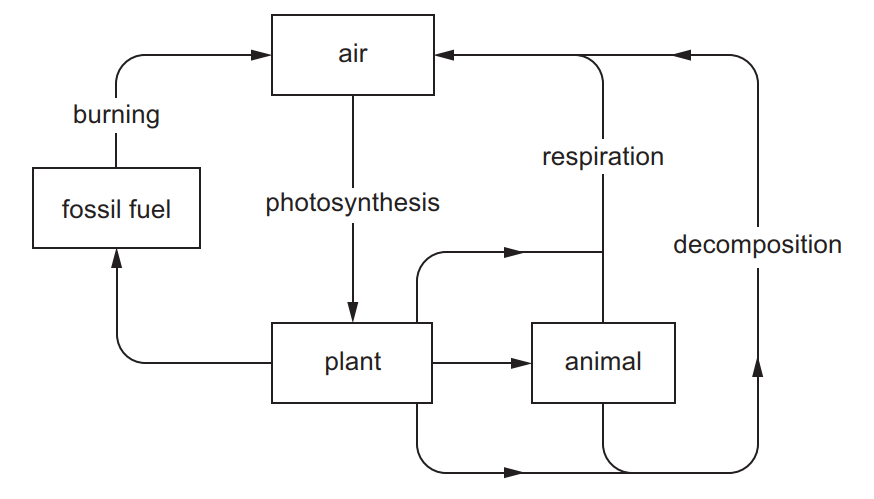
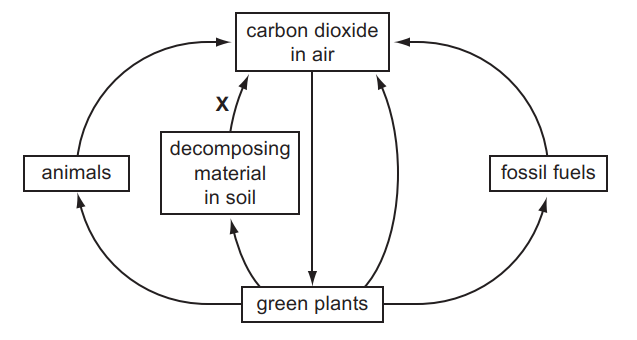
The diagram represents the carbon cycle.
Which process is represented by arrow X?
Image:
Q5 (binary/octet-stream)
Answer
-
A combustion
-
B feeding
-
C photosynthesis
-
D respiration
Question 10
Question
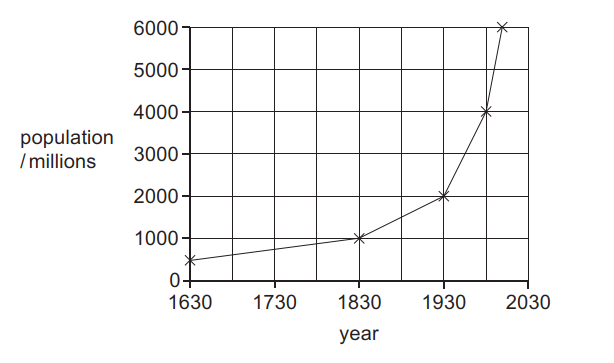
The graph shows the increase in the human population of the world since 1630.
What was the longest time taken for the population to double?
Image:
Q6 (binary/octet-stream)
Answer
-
A 100 years
-
B 200 years
-
C 300 years
-
D 400 years
Question 11
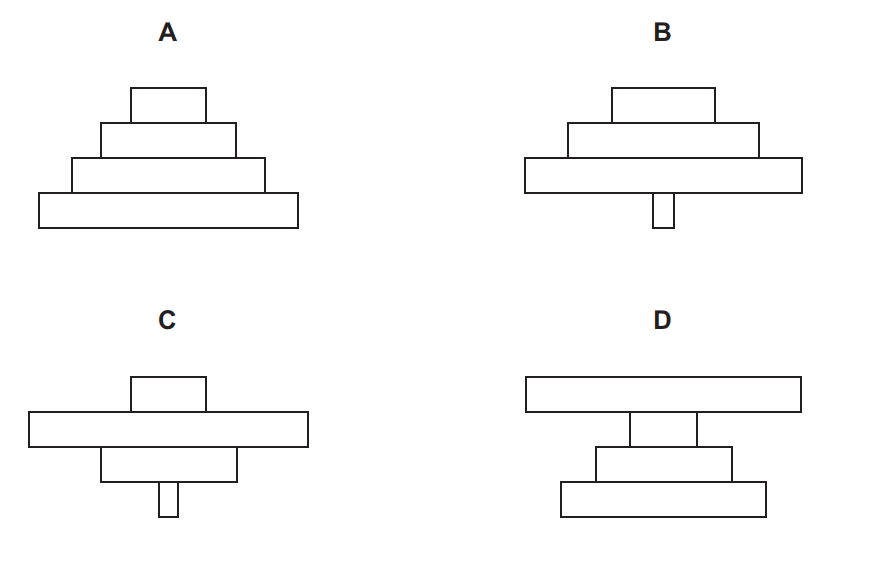
Question
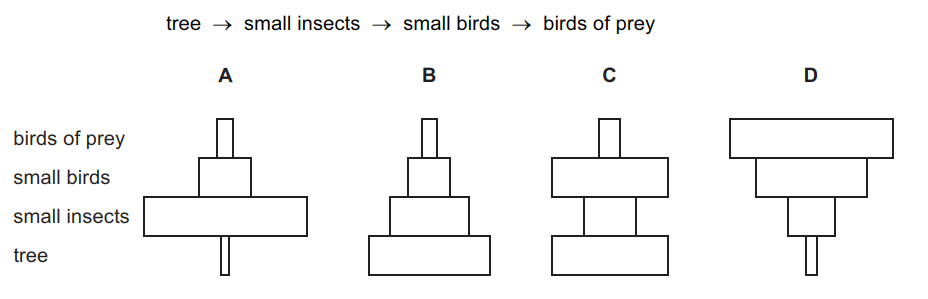
The diagram shows a food chain.
What is the correct pyramid of numbers for this food chain?
Image:
Q7 (binary/octet-stream)
Answer
-
A
-
B
-
C
-
D
Question 12
Question
Which process is not part of the water cycle?
Answer
-
A condensation
-
B fossilisation
-
C precipitation
-
D transpiration
Question 13
Answer
-
A
-
B
-
C
-
D
Question 14
Question
The surface waters of the ocean contain a population of microscopic plants.
Which factor would result in fewer of these plants?
Answer
-
A an increase in the population of microscopic animals
-
B greater concentration of mineral nutrients
-
C higher temperature
-
D more light
Question 15
Question
By which process does water enter the atmosphere?
Answer
-
A condensation
-
B photosynthesis
-
C precipitation
-
D transpiration
Question 16
Question
The diagram shows organisms feeding on a dead rat and one of the organisms which, in turn, feeds on them.
What is needed to complete the food chain?
Image:
Q12 (binary/octet-stream)
Answer
-
A carnivore
-
B consumer
-
C predator
-
D producer
Question 17
Question
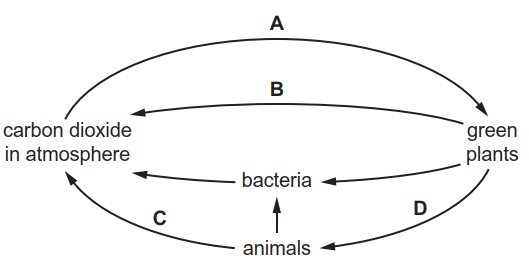
The diagram shows part of the carbon cycle.
Which labelled arrow represents photosynthesis?
Image:
Q13 (binary/octet-stream)
Answer
-
A
-
B
-
C
-
D
Question 18
Question
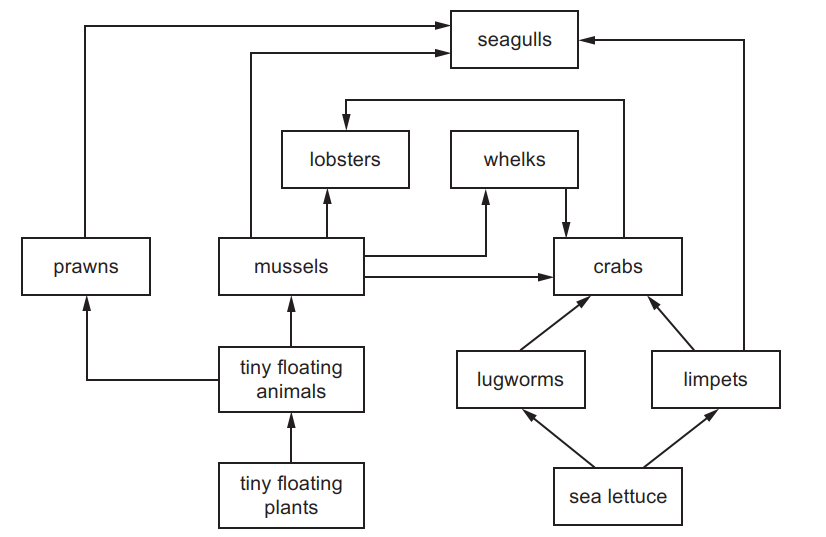
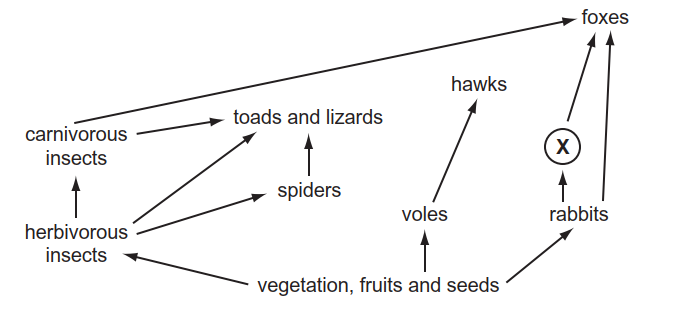
The diagram shows a food web.
Which organisms feed on the greatest variety of other organisms, as shown in this food web?
Image:
Q14 (binary/octet-stream)
Answer
-
A crabs
-
B limpets
-
C lobsters
-
D mussels
Question 19
Question
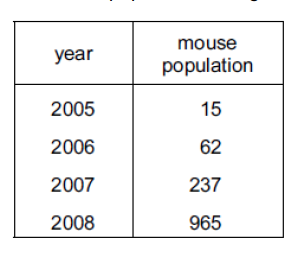
In 2005, fifteen mice were set free on an island where mice had never lived before. The table
shows how their population changed over the next three years.
What caused the population change shown in the table?
Image:
Q15 (binary/octet-stream)
Answer
-
A lack of food
-
B lack of predators
-
C lack of space
-
D lack of water
Question 20
Answer
-
A
-
B
-
C
-
D
Question 21
Question
Which organisms remove carbon dioxide from the atmosphere?
Answer
-
A carnivores
-
B decomposers
-
C herbivores
-
D producers
Question 22
Question
The diagram shows the water cycle.
Which letter represents "transpiration"?
Image:
Q18 (binary/octet-stream)
Answer
-
A
-
B
-
C
-
D
Question 23
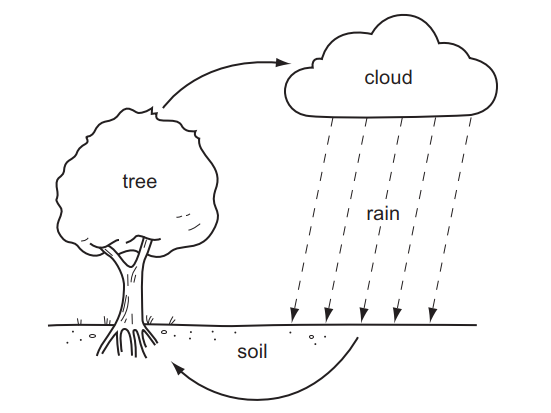
Question
The diagram shows a simple water cycle.
What is responsible for water loss from the tree?
Image:
Q19 (binary/octet-stream)
Answer
-
A evaporation
-
B respiration
-
C photosynthesis
-
D translocation
Question 24
Question
A food chain shows how organisms depend on each other for their sources of energy, but all energy comes ultimately from one source.
What is this energy source?
Answer
-
A leaves of plants
-
B meat
-
C sunlight
-
D water
Question 25
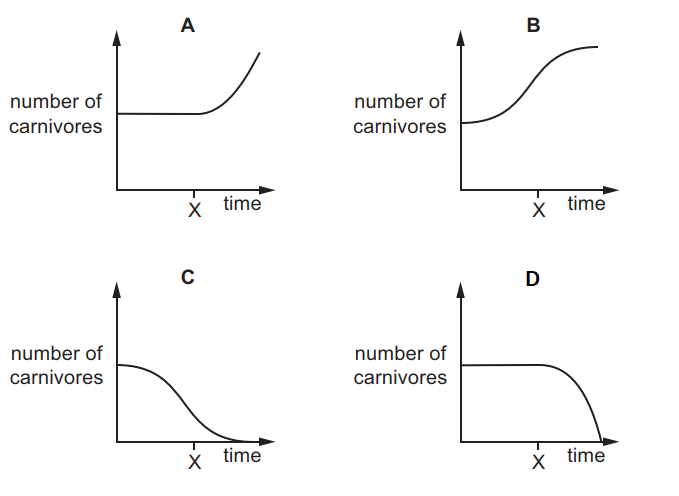
Question
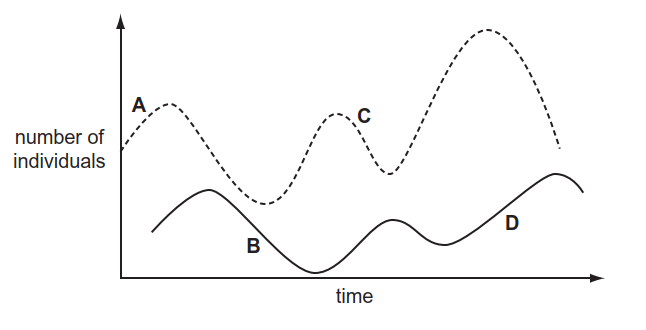
The graphs show the number of carnivores in a habitat over a period of time.
At time X the herbivores in their food chain are removed from the habitat.
Which graph shows the effect of this on the number of carnivores?
Image:
Q21 (binary/octet-stream)
Answer
-
A
-
B
-
C
-
D
Question 26
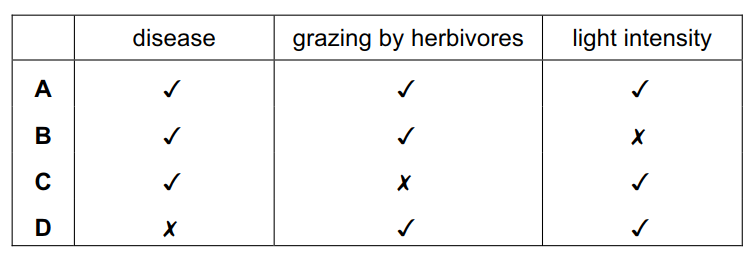
Question
Which factors affect the rate of growth of a plant population?
Image:
Q22 (binary/octet-stream)
Answer
-
A
-
B
-
C
-
D
Question 27
Answer
-
A a carnivore
-
B a decomposer
-
C a herbivore
-
D a producer
Question 28
Answer
-
A
-
B
-
C
-
D
Question 29
Question
Which of the following is an example of a food chain?
Answer
-
A carnivore → herbivore → producer
-
B flower → fruit → seed
-
C grass → antelope → lion
-
D starch → maltose → glucose
Question 30
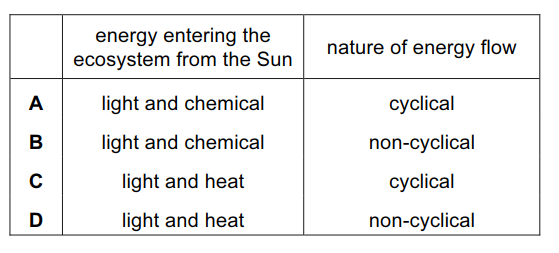
Question
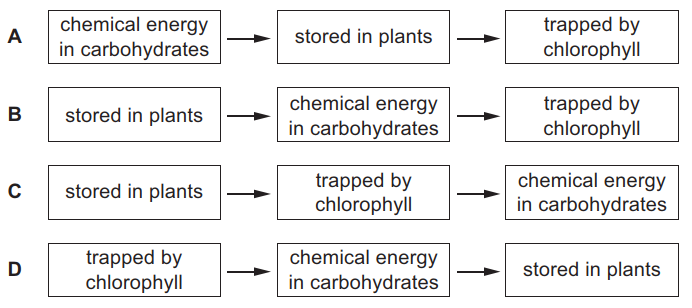
Which pair of statements about energy flow in ecosystems is correct?
Image:
Q28 (binary/octet-stream)
Answer
-
A
-
B
-
C
-
D
Question 31
Question
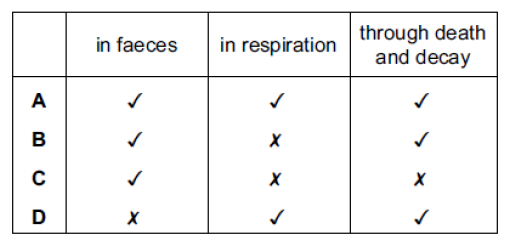
Herbivores take in carbon atoms from plants.
How do carbon atoms leave the herbivores?
Image:
Q29 (binary/octet-stream)
Answer
-
A
-
B
-
C
-
D
Question 32
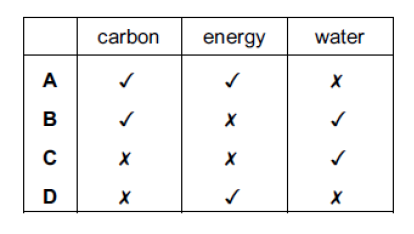
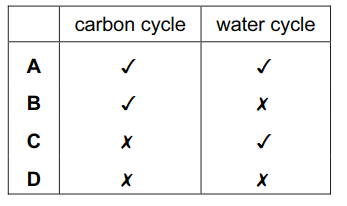
Question
In which natural cycles do photosynthesis and respiration both play a part?
Image:
Q30 (binary/octet-stream)
Answer
-
A
-
B
-
C
-
D
Question 33
Question
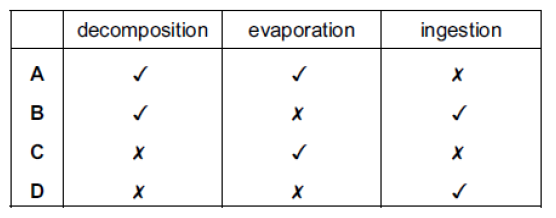
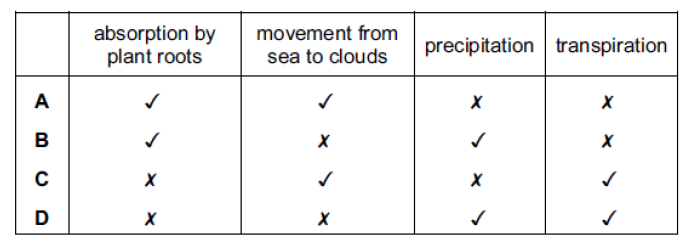
In which stages in the water cycle is the water in vapour form?
Image:
Q31 (binary/octet-stream)
Answer
-
A
-
B
-
C
-
D
Question 34
Question
The diagram shows a pyramid of biomass for all organisms in an ecosystem.
Which organisms are carnivores?
Image:
Q32 (binary/octet-stream)
Answer
-
A P and Q
-
B P and R
-
C Q and R
-
D R and S
Question 35
Question
Which process removes carbon dioxide from the atmosphere?
Answer
-
A combustion
-
B decomposition
-
C photosynthesis
-
D respiration
Question 36
Question
The three-toed sloth is a mammal that lives in the forests of Central America. Sloths are eaten by
wild cats such as jaguars and also by snakes. The sloths mainly eat leaves.
What is the original source of the energy supplied to the jaguars?
Answer
-
A leaves
-
B sloths
-
C snakes
-
D Sun
Question 37
Question
The graphs show the changes in the populations of predator and prey over a period of time.
Which point on the graph shows a decrease in predator population?
Image:
Q35 (binary/octet-stream)
Answer
-
A
-
B
-
C
-
D
Question 38
Question
Which statement explains why the energy flow in a food chain is in one direction?
Answer
-
A Decomposers recycle nutrients for plants.
-
B Energy is not recycled.
-
C Plants convert light energy to chemical energy.
-
D The number of organisms decreases at each level in the food chain.
Question 39
Question
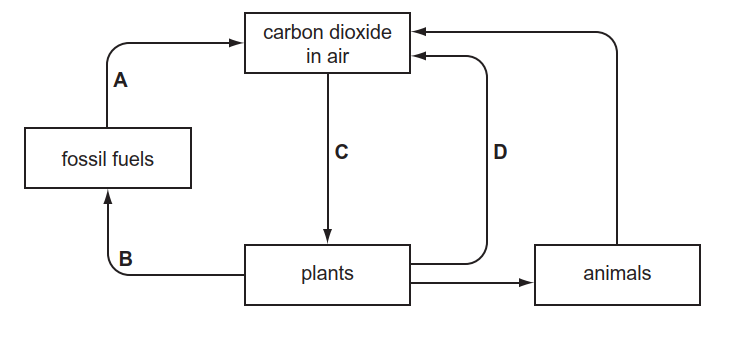
The diagram shows part of the carbon cycle.
Which letter represents photosynthesis?
Image:
Q37 (binary/octet-stream)
Answer
-
A
-
B
-
C
-
D
Question 40
Question
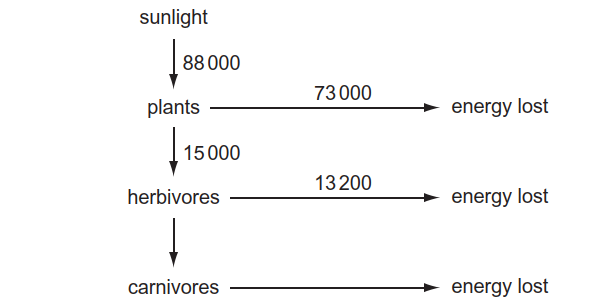
The numbers in the diagram below show the amount of energy, in kJ, transferred through a part of an ecosystem.
How much energy, in kJ, is transferred from herbivores to carnivores?
Image:
Q38 (binary/octet-stream)
Answer
-
A 15000 + 13200
-
B 15000 - 13200
-
C 88000 + 15000
-
D 88000 - 15000
Question 41
Question
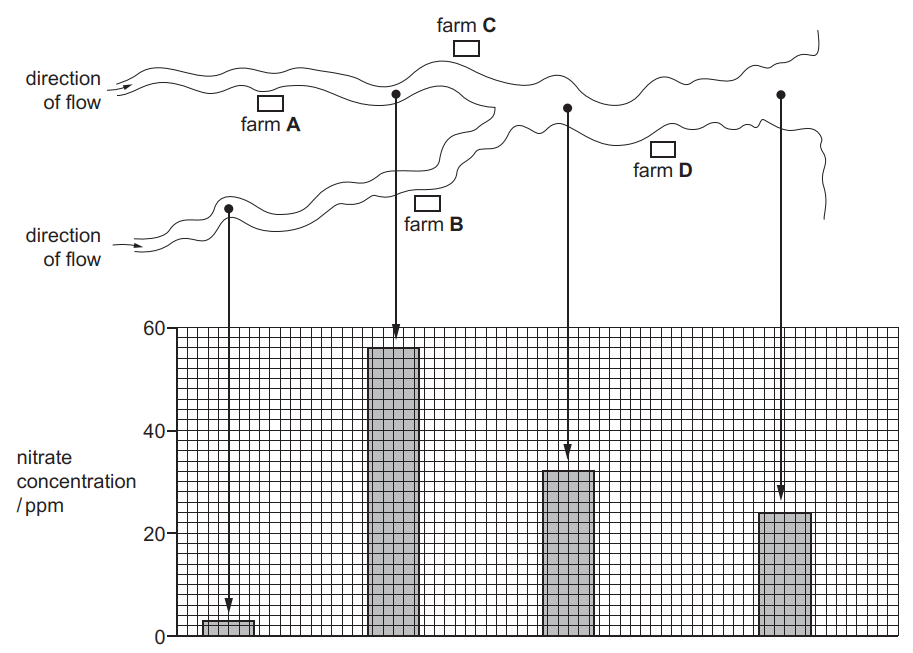
The diagram shows the positions of four farms and the concentrations of nitrate at different points in a river.
Which farm is likely to have been using too much fertiliser on its land?
Image:
Q39 (binary/octet-stream)
Answer
-
A
-
B
-
C
-
D
Question 42
Question
The diagram shows a food chain.
rice plant → caterpillar → song bird → hawk
How many decomposers are shown in this food chain?
Answer
-
A 0
-
B 1
-
C 2
-
D 3
Question 43
Question
The diagram shows the positions of four farms and the concentrations of nitrate at different points in a river.
Which farm is likely to have been using too much fertiliser on its land?
Image:
Q39 (binary/octet-stream)
Answer
-
A
-
B
-
C
-
D
Question 44
Question
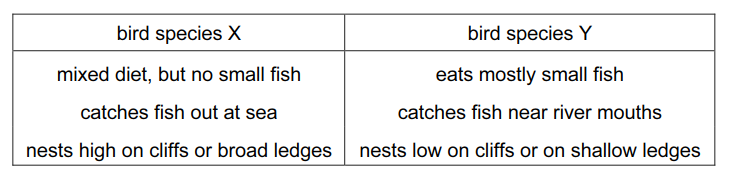
The table shows some information about two closely related species of sea bird.
Sewage pollution at the mouth of a river destroys its fish stocks.
What is likely to happen to local populations of these birds?
Image:
Q40 (binary/octet-stream)
Answer
-
A There will be no change to either species.
-
B Species X numbers will decrease, species Y will remain constant.
-
C Species Y numbers will decrease, species X will remain constant.
-
D Both species numbers will increase.
Question 45
Question
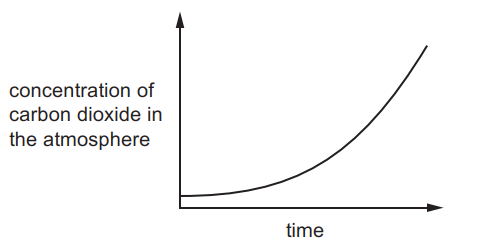
Three human activities are listed.
1 burning fossil fuels
2 deforestation
3 overusing fertilisers
Which activities can cause the change shown in the graph?
Image:
Q41 (binary/octet-stream)
Answer
-
A 1, 2 and 3
-
B 1 and 2 only
-
C 1 only
-
D 2 and 3 only
Question 46
Question
What is a reason for conserving plant species?
Answer
-
A to absorb oxygen from the air
-
B to decrease rainfall
-
C to obtain drugs for medicinal use
-
D to release carbon dioxide into the air
Question 47
Question
What is reduced after deforestation?
Answer
-
A force of rain hitting the ground
-
B rainwater run-off
-
C soil erosion
-
D soil fertility
Question 48
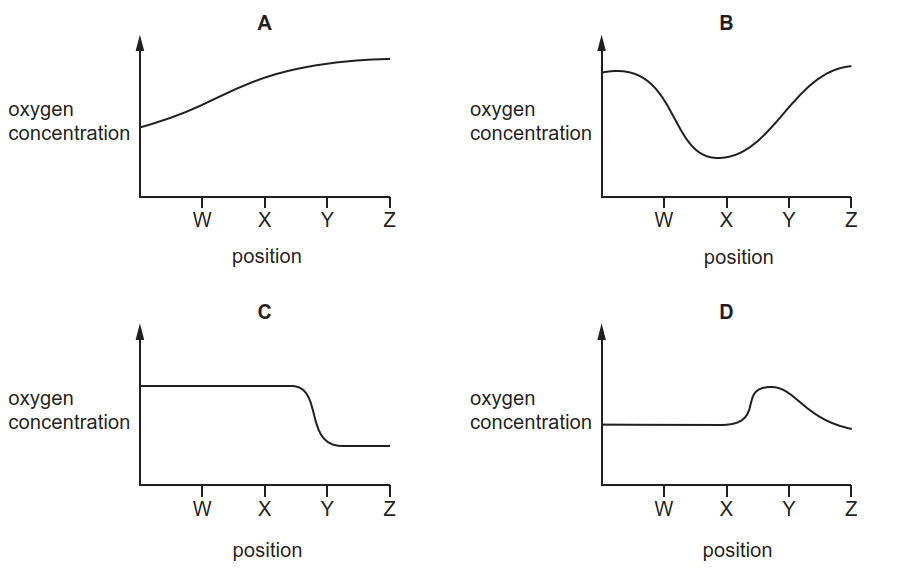
Question
The diagram shows four positions on a river where water samples were taken.
Which graph shows oxygen concentrations in the river?
Image:
Q44 (binary/octet-stream)
Answer
-
A
-
B
-
C
-
D
Question 49
Question
A large amount of herbicide is applied to a field. Heavy rainfall carries much of it into a nearby lake.
What will be the effect of this on the lake?
Answer
-
A Herbicide decreases the growth of water plants.
-
B Herbicide decreases the number of bacteria.
-
C Herbicide increases the rate of evaporation from the lake.
-
D Herbicide kills the fish.
Question 50
Question
Which two gases both contribute to global warming?
Answer
-
A carbon dioxide and methane
-
B methane and oxygen
-
C oxygen and sulfur dioxide
-
D sulfur dioxide and carbon dioxide
Want to create your own Quizzes for free with GoConqr? Learn more.