
Quiz
Stats Exam
This quiz has question types that open in the usual player.
Questions in this quiz (74)
1Which of the following are true about confidence intervals (select all that apply):
- Athey give me information about how well my sample mean captures the true population mean
- Bif i want to be more confident that my confidence interval 'captures' the true population mean, I should choose a smaller CI (e.g., 90% CI instead of 95% CI)
- Cif I want to be more confident that my confidence interval 'captures' the true population mean, I should choose a larger CI (e.g., 95% CI instead of 90% CI)
- Da 90% CI tells me that 9 out of 10 times when I draw a sample and create confidence intervals, the true population mean will fall within the confidence interval
- Ea 90% CI tells me that there is a 90% probability that the true population mean is contained within the CI of my one sample
- Fthe central limit theorem is critical to why we can create CIs using the formulas shown in lecture (critical z, standard error of the mean)
- Gwe do not need the central limit theorem to hold true to create CIs using the formulas shown in lecture (critical z, standard error of the mean)
2Which of the following are true about the p value
- Ait equals your alpha value
- Bit is a measure of how likely you are to commit type 1 error
- Cit is a measure of how likely you are to commit type 2 error
- Dif the value is less than your alpha value you have statistical significance
- Eall of the above
3Why is a chi-square test always a one tailed test?
- AThe chi-square distribution is always positive
- BThe chi-square statistic can only always be positive
- CNone of the above
4The following distributions are dependent on degrees of freedom, positively skewed, AND only use one-tailed tests.
- ANormal distribution
- BT-distribution
- CChi squared distribution
- DF-distribution
5Under which situation(s) you would want to do a MANOVA test?
- AYour categorical variable of interest has multiple levels
- BYou want to test multiple dependent variables simultaneously
- CYou want to test if there is a difference between two sample means
- DYou have two independent factors of interest and you want to test the effect of each factor
6Which of the following is true about the F critical value?
- AIt is calculated using alpha (or the amount of type 1 error you are willing to accept)
- BIt varies based on the sample size or the number of groups in your data
- CIt varies based on the mean value of each of your groups in your data
- DIt is used to calculate the p value of your statistical test
- EIt is used to test for significance
7Say I want to test the hypothesis that students at the University of Michigan pay significantly less in rent than the median US rent ($1,012). In order to test my hypothesis, I conduct an email survey and gather data on monthly rent for 100 UM students.
With an alpha of 0.05 and sample size of 100, I calculate a t-critical value of 1.660391 using the qt() function in R:
qt(0.95, df=99)
[1] 1.660391
Then, I run a one-tailed, one-sample t test using the t.test() function in R. When I examine the output, I see that I have a t statistic of 0.98695.
t.test(sample, alternative="less", mu=1012)
t = 0.98695, df = 99
How should I interpret this result?- AUM students pay significantly more than the median US rent
- BUM students pay significantly less than the median US rent
- CUM students do not pay significantly more than the median US rent
- DUM students do not pay significantly less than the median US rent
8I want to see if the price of avocados in Michigan grocery stores is more expensive than the national average price of $1. Which of the following are correct ways to state the null hypothesis?
- AThe price of Michigan avocados is not different than the national average.
- BThe price of Michigan avocados is less than or equal to the national average.
- CThe price of Michigan avocados is greater than the national average.
- DThe price of Michigan avocados is not greater than the national average.
9Correlation is strong when:
- Ar=1
- Br=-1
- CThe sum of squares of residuals is high
- DThe sum of squares of residuals is low
10Which choice(s) means that the correlation between the two variables is not significant?
- AThe correlation coefficient is greater than 0.05
- BThe correlation coefficient is less than 0
- CThe p-value of a correlation test (cor.test()) is greater than 0.05
- DThe t statistic of a correlation test (cor.test()) is greater than 0.05
11What is a residual?
- AIt is the slope of the best fit line
- BIt is the intercept of the best fit line
- CIt is the correlation of the best fit line
- DIt is the difference between the observed and predicted y from the best fit line
12I run a linear regression and have an R^2 value of .84. Which of the following are the correct interpretations?
- AThe correlation between the independent variable and dependent variable is 0.84
- B84% of the variation in the dependent variable can be explained using the linear model
- CThe sum of squares of y divided by the sum of squares of predicted y equals 0.84
- DYou can be 84% confident that there is a significant relationship between the independent variable and dependent variable
13I created a linear model using 'pressure' as the dependent variable and 'temperature' as the independent variable. Which number represents the slope of the best fit line?
https://piazza.com/redirect/s3?bucket=uploads&prefix=attach%2Fjqqm6j5nlwezn%2Fj6wl57d7vw8z3%2Fjsdxrpaooua9%2FPicture1.png- AA
- BB
- CC
- DD
14How are the correlation coefficient and the slope (also known as the beta coefficient) of a univariate regression related?
- AThey are the same value
- BThe correlation coefficient is used to calculate the slope (beta coefficient)
- CThey are unrelated
- DNone of the above
15Which of the following will help increase the chances that your result is causal and not just correlational?
- AA. Add confounding factors into your analysis as additional x variables
- BB. Try to do an experimental over an observational study
- CC. In an experiment, you should have both treatment and control groups
- DD. In an experiment, you should randomize your treatment and control groups
- EE. All of the above
16I want to see if there is a difference in heights of tomato plants if I use fertilizer A, fertilizer B, or no fertilizer. Each group has 20 plants. The result of the Shapiro-Wilk test is p=0.035. Which test should I use for analysis?
- ATwo-tailed two sample T-Test
- BANOVA
- CWilcoxon-Mann-Whitney U test
- DKruskal-Wallis test
17If you can only do an observational study, which of the following strategies would you try?
- ACollect as much data as possible
- BCollect data on factors which will also affect your dependent variable in addition to your independent variable(s) of interest
- CTry to mimic an experiment with the observed data
- DAll of the above
18Which of the following are true about type II error? Select all that apply.
- AA. Type II error is equal to 1 - alpha
- BB. Increasing the chance of type I error will decrease the probability of type II error
- CC. Type II error is more likely to occur if the effect size is small
- DD. Type II error occurs when we fail to reject a false null hypothesis (false negative)
- EE. A beta level of 0.2 indicates we have a 20% probability of committing type II error
19What can you do if you want to decrease the chance of Type II Error?
- ADecrease the effect size
- BIncrease the sample size
- CAdd appropriate control variables other than your independent variable
- DDecrease the alpha (level of significance)
- EAll of the above
20I want to run a power test to determine the sample size I need to achieve β=0.8. Which of the following ways can I estimate effect size?
- APerform a pilot study
- BUse results from a similar or related study
- CUse the effect size formula
- DRoughly estimate effect size
21In which situations can you NOT accurately interpret the effect of each individual predictor variable (in its native units)?
- APredictors are highly correlated
- BPredictors are not correlated
- CVIF of predictor is greater than 1
- DVariables are standardized
22What may happen if you create a multiple linear regression using two variables with a VIF result of 5.2? (Compared to run two univariate regressions separately)
- AThe R-squared value will increase
- BThe standard error for each beta coefficient will decrease
- CThe significance (p-value) of each independent variable may change
- DThe accuracy of predicted y will decrease
23Which of the following is true about the VIF?
- AIt tells you how correlated x is to y
- BIt tells you how correlated x is to the other x variables in the model
- CIt is constructed by regressing y on each x variable
- DIt is constructed by regressing each x variable on all the other x variables considered in the model
24Which of the following are true about multiple linear regression?
- AA. We will have multiple β coefficients (one for each parameter in the model)
- BB. For each parameter, we will have an intercept (β0) and error term (ε)
- CC. The β coefficient for each parameter is the slope of the best fit line that reduces the overall sum of squared errors in the model
- DD. The R^2 value represents how much of the variation in the dependent variable we can explain with the model
- EE. All of the above
25What are the reasons for using model selection techniques?
- AYou want to control for additional variables
- BTo reduce overfitting
- CIt is easier to interpret a model with fewer variables
- DNot all the variables are essential
26When comparing candidate models, which of the following methods should you use to determine which model is best?
- AA. Choose the model with the lowest adjusted R-squared value
- BB. Choose the model with the most significant p-value
- CC. Choose the model with the lowest AIC value
- DD. Choose the model with the highest variance inflation factor (VIF)
27What are the correct ways to compare the relative importance of different independent variables?
- ACompare the R-squared values of univariate regressions
- BCompare the p-values of independent variables in a multivariate regression
- CCompare the beta coefficients of independent variables in a multivariate regression
- DCheck the relative importance matrics using the relaimpo package in R
28What do I really want to check the normality of from a multiple linear regression to make sure it meets assumptions?
- AA. normality of each independent variable
- BB. normality of the dependent variable
- CC. normality of the residuals
- DD. normality of the sum of squares
29Which of the following statements are true regarding an ANOVA & Linear Regression?
- AIf you pick the same dependent and independent variables, the two tests will tell you different variables are significant
- BThe ANOVA is a special case of the linear regression, where independent variables are only categorical
- CThe order in which you put in your independent variables changes the result in an ANOVA
- DThe order in which you put in your independent variables changes the results in a linear regression
- EYou are able to see all pairwise combinations of group differences using a linear regression
30Below is an ANCOVA using data from mtcars in R. The dependent variable is miles per gallon. The independent variables are vs (whether the engine is v shaped or straight) and am (manual transmission or automatic transmission). The intercept represents mpg of an automatic v engine. The vs line indicates change in mpg for straight engines. The am line indicates change in mpg for manual transmissions. The vs:am line indicates the effect of the interaction for straight manual engines. What is the expected mpg for cars with straight manual engines?
https://piazza.com/redirect/s3?bucket=uploads&prefix=attach%2Fjqqm6j5nlwezn%2Fj6wl59xasv512p%2Fjtf6h2qf5txd%2FScreen_Shot_20190318_at_10.46.48_PM.png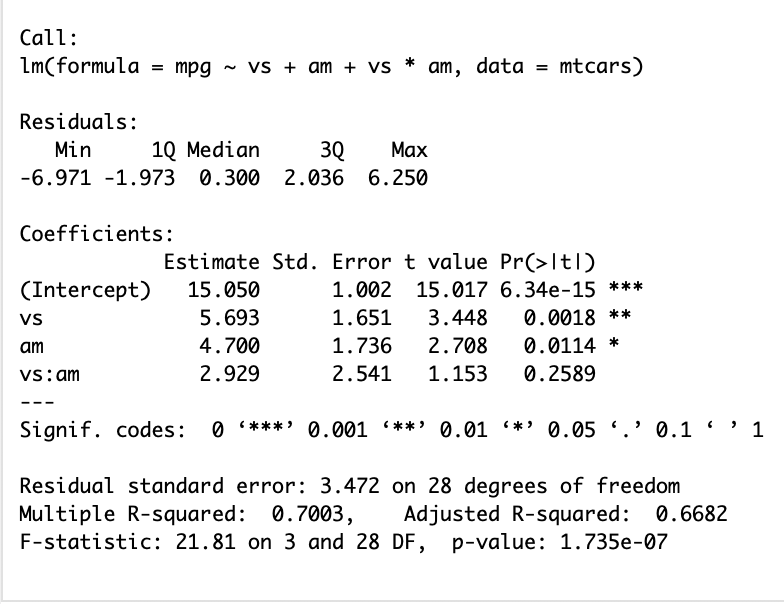
- AA) 15.050
- BB) 19.750
- CC) 20.743
- DD) 25.443
- EE) 28.372
31Which of the following statements are false about interaction terms?
- AA. Interaction terms can be used in ANOVAs, ANCOVAs, and linear regressions
- BB. You can only use interaction terms with continuous variables
- CC. Interaction terms give us an indication of how well our model interacts with the data
- DD. They allow us to examine if one independent variable has a different affect on our dependent variable depending on another independent variable
32Which are the assumptions for ANCOVA (continuous+categorical variables) but not for linear regression (continuous variables only)?
- AThe samples must be independent of one another
- BEach population must have the same variance
- CThere is a linear relationship between the continuous predictor and the dependent variable
- DThe populations of interest must be normally distributed
33Why is an omitted variable a problem?
- AA. Your model will not converge
- BB. Your residuals will not be normally distributed
- CC. You will not have accurate beta coefficients on at least one x variable
- DD. Your model will have poor fit
34What's the benefit of the random effects compared to the fixed effects?
- AIt allows more control for omitted variables
- BIt has smaller standard errors
- CIt allows for more degrees of freedom
- DIt allows a more generalized model
35A fixed effect model should be used when:
- AA) You intend to draw generalized conclusions
- BB) Unobservable factors differ by site and correlate with the dependent and independent variables
- CC) You have included enough covariates to explain the important site differences
- DD) You are only interested in the specific sites in the model
36Which of the following are true about omitted variables?
- AA. They are the same as fixed effects
- BB. They can be controlled for using fixed effects
- CC. They can be discovered by using random effects
- DD. Failing to include omitted variables can inflate the Beta coefficients in a model
37In what situations would you want to use an ARIMA?
- AA) There is autocorrelation according to the Durbin Watson Test
- BB) The residuals are not homoscedastic
- CC) There is autocorrelation according to the ACF plots
- DD) The residuals are not normal
- EE) The data follows an individual over time
38Say you are interested in using a linear model to understand mammal activity throughout the day, but when you plot your dataset it looks like this:
https://piazza.com/redirect/s3?bucket=uploads&prefix=attach%2Fjqqm6j5nlwezn%2Fjbznm3k3y2335q%2Fjtzw7f0muvuf%2FScreen_Shot_20190402_at_10.43.01_AM.png
Which of the following are true?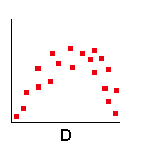
- AA. You cannot use a linear model because the data have a non-linear relationship
- BB. You need to transform your data to make it more normal
- CC. There is a high degree of spatial autocorrelation in the dataset
- DD. You can still model this data using the linear model framework by adding a quadratic term
39From the example in class regarding university admissions, which are the correct ways to interpret the odds of admission for every one point increase in GRE score? (note: exp(0.002264)=1.002267).
https://piazza.com/redirect/s3?bucket=uploads&prefix=attach%2Fjqqm6j5nlwezn%2Fj6wl59xasv512p%2Fju1zrulk3ta5%2FScreen_Shot_20190403_at_9.52.33_PM.png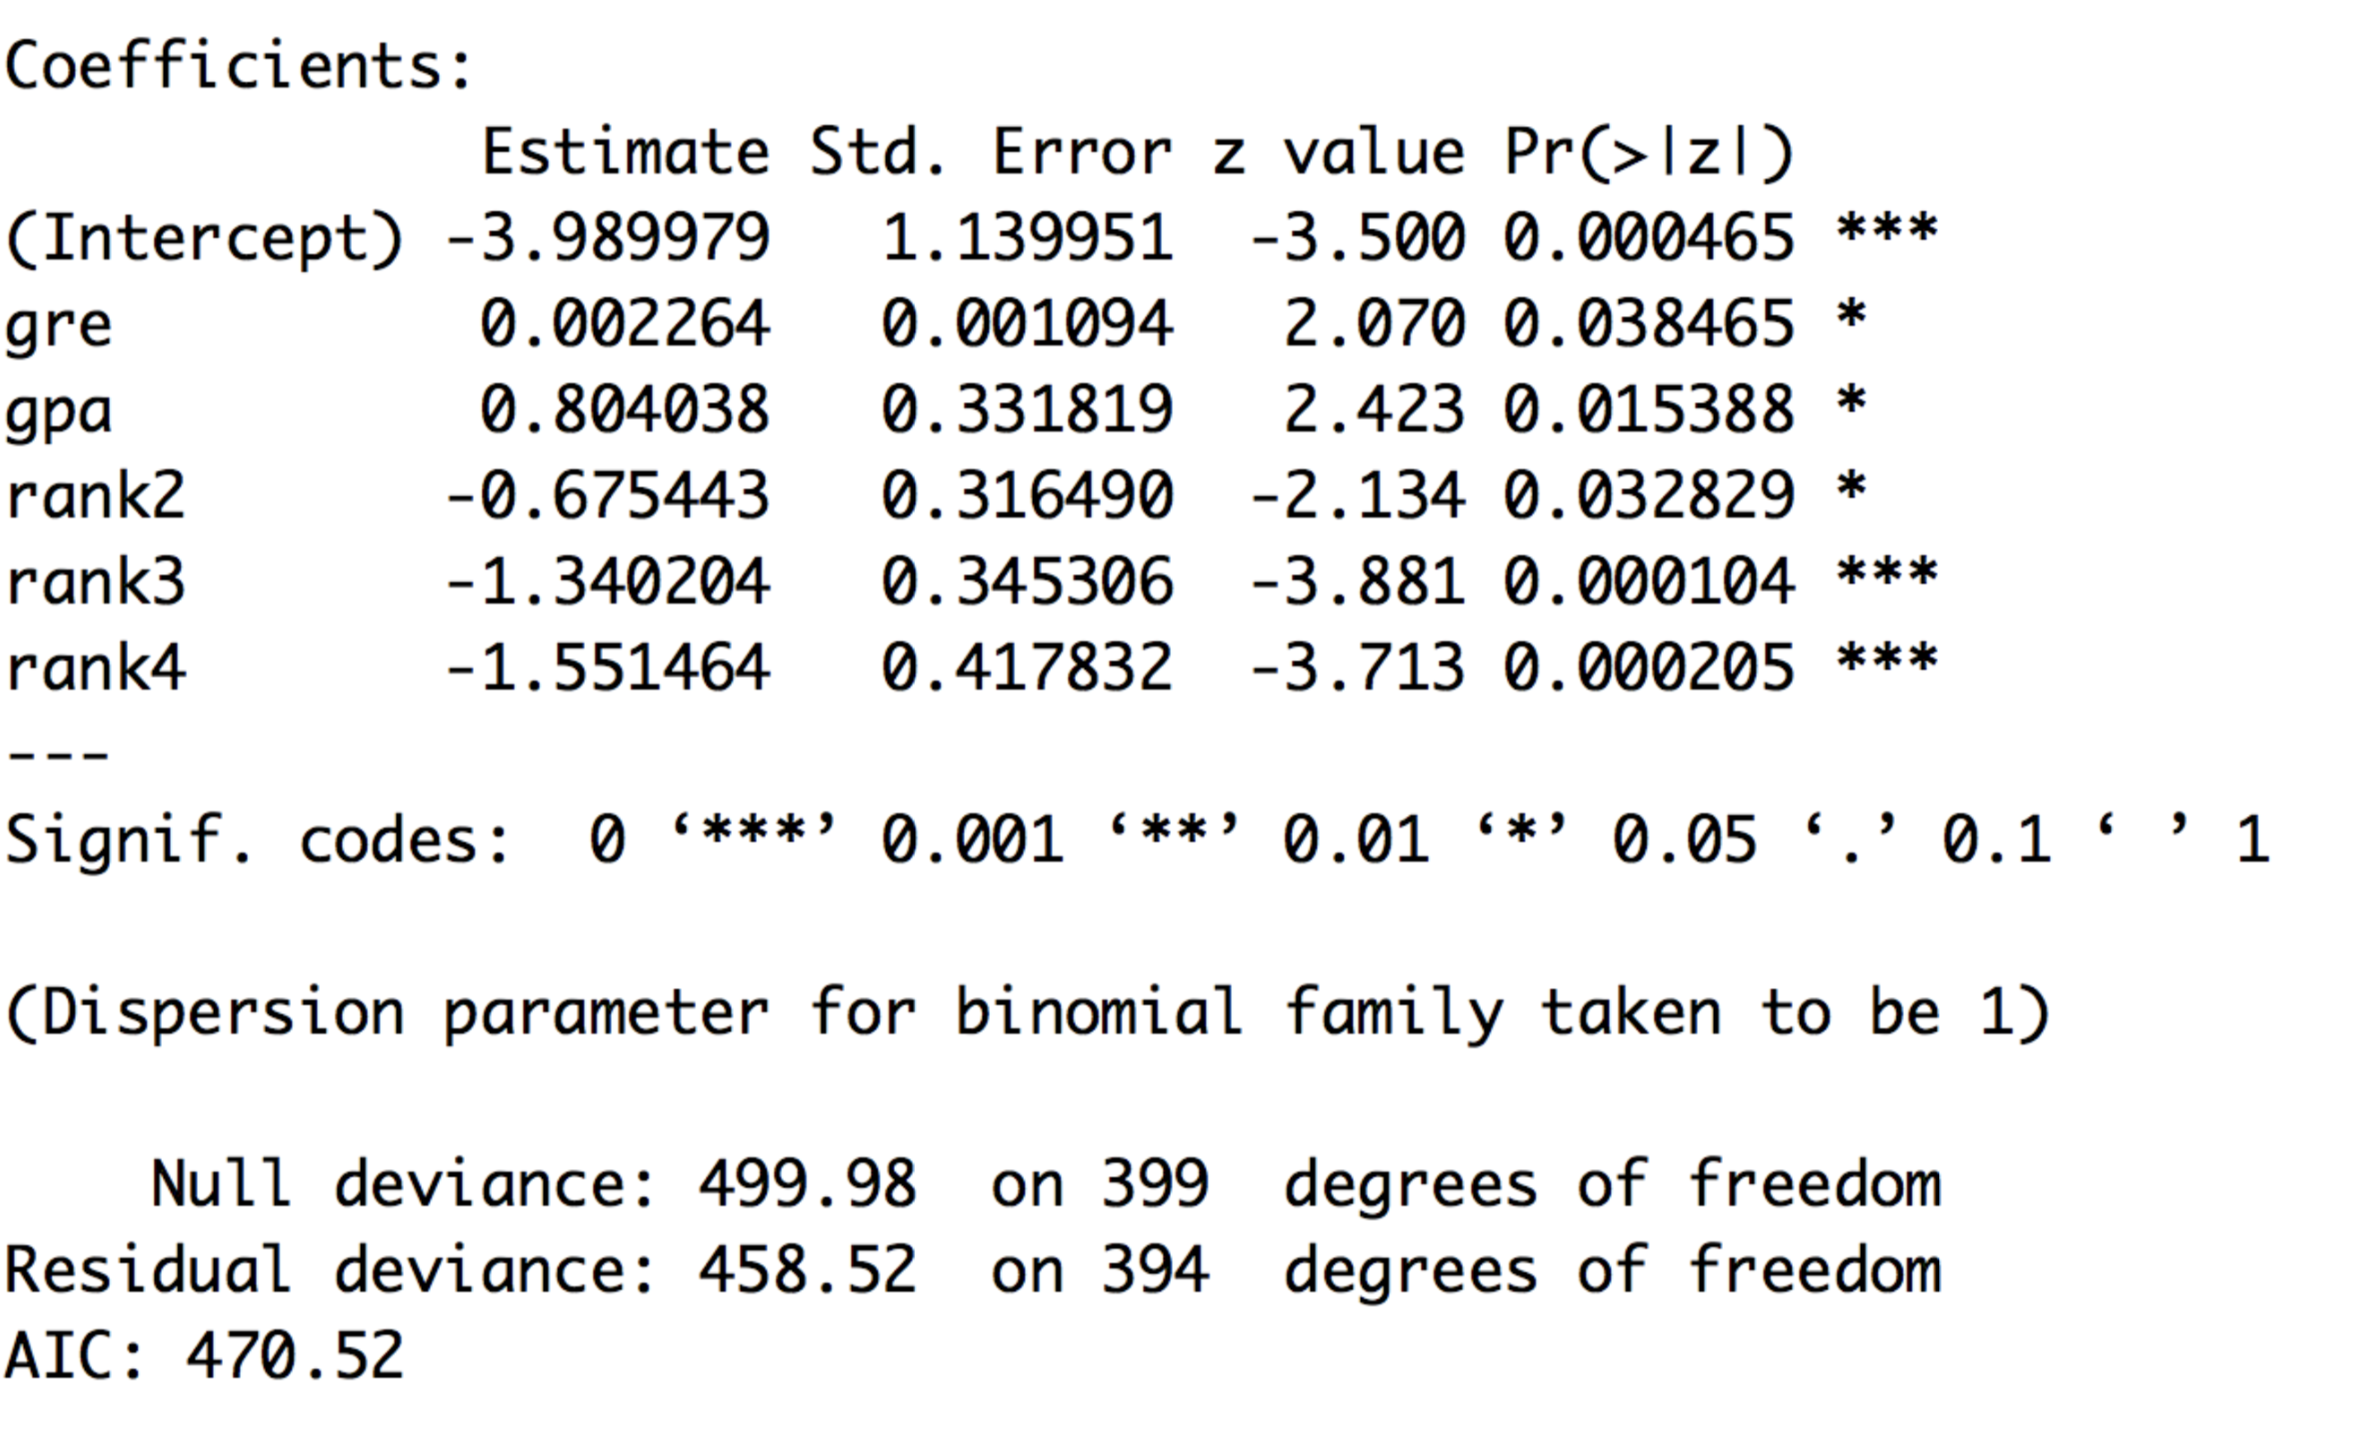
- AA) For every 1 point increase in GRE score the odds of being admitted to grad school increase by a factor of 0.002264
- BB) For every 1 point increase in GRE score the odds of being admitted to grad school increase by a factor of 1.002267
- CC) For every 1 point increase in GRE score the odds of being admitted to grad school increase by 0.2267%
- DD) There is no associated between GRE score and being admitted to grad school
40Categorize each of the following types of variables as nominal, ordinal, discrete, or continuous.
The minimum daily temperature in Ann Arbor for every day in 2017- Anominal
- Bordinal
- Cdiscrete
- Dcontinuous
41Categorize each of the following types of variables as nominal, ordinal, discrete, or continuous.
Each student’s favorite pet- Acontinuous
- Bnominal
- Cdiscrete
- Dordinal
42Categorize each of the following types of variables as nominal, ordinal, discrete, or continuous.
The number of people who live in every apartment complex in Ann Arbor- Acontinuous
- Bnominal
- Cdiscrete
- Dordinal
43Categorize each of the following types of variables as nominal, ordinal, discrete, or continuous.
The letter grade that each student received in last year’s class- Acontinuous
- Bnominal
- Cdiscrete
- Dordinal
44Is the mean, median, or mode more sensitive to outliers in a dataset?
- Aa. The mean is more sensitive to outliers
- Bb. The median is more sensitive to outliers
- Cc. The mode is more sensitive to outliers
45I am running a study where I am trying to quantify how much students composted last year (2018). To collect data, I send out an email to all students at the University of Michigan asking them the number of weeks that they composted last year. Are there any types of bias that I may have based on my sampling strategy? Please select all answers that apply
- ANonresponse bias
- BVoluntary response bias
- COvercoverage
- DSocial desirability bias
- EUndercoverage
46For each of the below, please write if it is a characteristic of the t distribution, the z distribution, both, or neither (3 points):
The curve is flatter and the shape of the curve changes based on the sample size- At distribution
- Bz distribution
- Cboth
- Dneither
47For each of the below, please write if it is a characteristic of the t distribution, the z distribution, both, or neither (3 points):
b. Area under the curve = 1- At distribution
- Bz distribution
- Cboth
- Dneither
48For each of the below, please write if it is a characteristic of the t distribution, the z distribution, both, or neither (3 points):
c. The distribution is skewed to the right- At distribution
- Bz distribution
- Cboth
- Dneither
49For each of the below, please write if it is a characteristic of the t distribution, the z distribution, both, or neither (3 points):
d. When the sample size is 30 or greater, the curve matches a normal distribution- At distribution
- Bz distribution
- Cboth
- Dneither
50For each of the below, please write if it is a characteristic of the t distribution, the z distribution, both, or neither (3 points):
e. The distribution is bell shaped and symmetric around the mean- At distribution
- Bz distribution
- Cboth
- Dneither
51For each of the below, please write if it is a characteristic of the t distribution, the z distribution, both, or neither (3 points):
f. In order to use this distribution for statistical tests, you have to assume the population is normally distributed- At distribution
- Bz distribution
- Cboth
- Dneither
52When calculating confidence intervals, would you look up the critical score from either the z distribution or the t distribution when:
N < 30- At
- Bz
53When calculating confidence intervals, would you look up the critical score from either the z distribution or the t distribution when:
N > 30- At
- Bz
54If I asked you to calculate the 90% confidence interval of a dataset with N = 100, you would look up a probability value of [blank_start]0.05[blank_end] in a z-score table
- A0.05
55Which of the following is true about a 95% confidence interval of the mean Please mark all answers that apply:
- AThere is a 95% probability that any given confidence interval from a random sample will contain the true population mean.
- BA range of values so defined that there is a 95% probability that the mean of your sample is the same as the mean of the population
- CThere is a 95% probability that the true population mean is within the confidence interval of one sample
- DYou need to know the degrees of freedom of your sample when calculating z critical values and using the z-look up table
- EYou must use the z distribution when sample size is < = 30
56If you set your alpha (level of significance) to be 0.01, we are saying that the chance of committing a Type I error should be no greater than
- Aa. 1%
- Bb. 5%
- Cc. 95%
- Dd. 99%
57You want to understand how cloud cover (a continuous variable) in Ann Arbor, MI compares to cloud cover in Beijing, China. What is this hypothesis:
Cloud cover in Ann Arbor, MI is less than or equal to cloud cover in Beijing, China.- Aa one-tailed alternate hypothesis
- Ba one-tailed null hypothesis
- Ca two-tailed alternate hypothesis for a two-sample t-test
- Da two-tailed null hypothesis
58You want to understand how cloud cover (a continuous variable) in Ann Arbor, MI compares to cloud cover in Beijing, China. What is the following statement?
Cloud cover in Ann Arbor, MI is significantly greater or less than cloud cover in Beijing, China.- Aa one-tailed alternate hypothesis
- Ba one-tailed null hypothesis
- Ca two-tailed alternate hypothesis for a two-sample t-test
- Da two-tailed null hypothesis
59Fill in which test (t-test, paired t-test, Welch’s t test, z test, chi-square test, one-way ANOVA, two-way ANOVA, MANOVA) is most appropriate for the following situations. In the case of continuous data, assume your data are normally distributed and variance among groups is equal unless otherwise stated. You can use each test as an answer more than once.
a. [blank_start]chi-square test[blank_end] You want to see whether there is an association between students’ favorite animal and a students’ favorite color.
b. [blank_start]t-test[blank_end] You want to test if there is a significant difference between air pollution (a continuous variable) levels in San Francisco and Ann Arbor.
c. [blank_start]one-way ANOVA[blank_end] You want to test whether the amount of tree cover (continuous variable) varies across temperate, tropical, and boreal forests.
d. [blank_start]paired t-test[blank_end] You want to see whether students’ heart rate varies before and immediately after opening up the R console (because R is so exciting!). You take repeat measures from the same student before and after opening up R.
e. [blank_start]Welch's t-test[blank_end] You want to see whether there is a significant difference in the turbidity of a lake (continuous variable) between Crooked Lake and Pickerel Lake. The variances of turbidity are not equal between both datasets- Achi-square test
- Bt-test
- Cone-way ANOVA
- Dpaired t-test
- EWelch's t-test
60Below is a figure showing a t distribution with the t statistic represented by the dashed vertical line.
t_distribution.png
a. Please tell us what the p value is for the above graphic if we are conducting a one-tailed t test. p =
[blank_start]0.0337[blank_end]
b. Can we reject the null hypothesis based on this p value for the one tailed test (alpha = 0.05)? Write only yes or no
[blank_start]yes[blank_end]
c. Please tell us what the p value is for the above graphic if we are conducting a two tailed t test. p =
[blank_start]0.0674[blank_end]
Can we reject the null hypothesis based on this p value for the two tailed test (alpha = 0.05)? Write only yes or no
[blank_start]no[blank_end]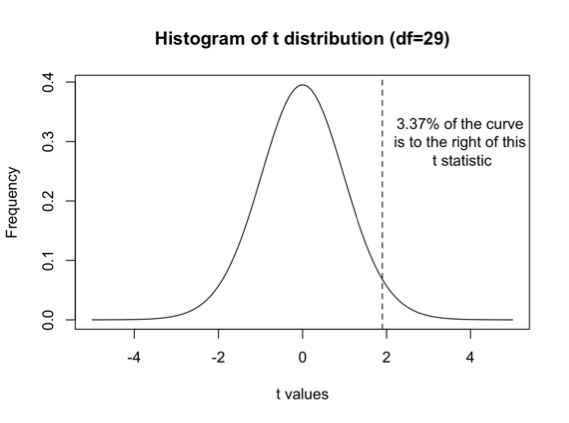
- A0.0337
- Byes
- C0.0674
- Dno
61Please indicate whether each of the following are assumptions for the two sample t-test (True) or are not assumptions for the two sample t-test (False):
a. Your dependent data are continuous and your independent data are categorical [blank_start]True[blank_end]
b. You have 3 or more categories that you want to test over [blank_start]False[blank_end]
c. The observations are independent [blank_start]True[blank_end]
d. The sample is not randomly selected from the population [blank_start]False[blank_end]
e. Your sample size is less than 30, and if it is greater than 30 you can only use this test if the sample is normally distributed [blank_start]False[blank_end]
f. There is equal variance between the two populations [blank_start]True[blank_end]- ATrue
- BFalse
- CTrue
- DFalse
- EFalse
- FTrue
62Which assumption can be relaxed with a Welch's T-test?
- AYour dependent data are continuous and your independent data are categorical
- BThe observations are independent
- CThere is equal variance between the two populations
63Which of the following can you relax using a paired t-test?
- AYour dependent data are continuous and your independent data are categorical
- BThe observations are independent
- CThere is equal variance between the two populations
64What type of analysis do you do if you have proportion data?
- Aa. t test
- Bb. ANOVA
- Cc. chi-square
- Dd. z test
65Which of the following is true regarding the chi-square test for independence?
- Aa. Your dependent and independent data are continuous
- Bb. Your dependent data are continuous
- Cc. The shape of the chi-square distribution changes based on the degrees of freedom
- Dd. The chi-square test has to always be run as a two-tailed test
- Ee. The chi-square distribution is symmetric
66Which of the following are true about a one-way ANOVA?
a. This test should be run if you have only two categorical variables that you want to compare (e.g., lead levels in Ann Arbor vs Flint) [blank_start]False[blank_end]
b. The samples must be independent of one another [blank_start]True[blank_end]
c. The sample sizes are equal across all groups [blank_start]False[blank_end]
d. Your dependent variable is continuous and your independent variable is categorical [blank_start]True[blank_end]
e. The F distribution is not symmetric and has a positive skew [blank_start]True[blank_end]
f. Conceptually, you will reject the null hypothesis if the variance within groups is larger than the variance between (or across) groups [blank_start]False[blank_end]- AFalse
- BTrue
- CFalse
- DTrue
- ETrue
- FFalse
67What is a residual produced from a linear regression?
- AIt is the difference between the actual value of x and predicted value of x
- BIt is the difference between the actual value of y and the predicted value of y
- CIt is the correlation between your x and y variable
- DIt is equivalent to the sum of square of y SSY
68Which of the following is true about the adjusted R square of a linear regression?
- AIt is always bigger than R squared
- BIt is always smaller than R squared
- CIt is always equal to the R squared
69Say I develop a linear model of the functional form y ~ x1 + x2 + x3. Which of the following can I do using the linear model (select all that apply)
- APredict variable y based on variables x1 x2 and x3
- BExamine which variables x1 x2 and x3 are signficantly associated with y after controlling for other variables
- CExamine the effect of a change in variable x1 on a change in y independent of the effect of variables x2 and x3
- DIdentify the relative importance of x1 x2 and x3 in explaining variation in y
70Say I have a dataset n = 20, where I have weighted of 10 cats and 10 dogs. The data are not normally distributed. I want to compare these two groups to see if the mean weight of cats and dogs are significantly different. What do I use?
- At-test
- BANOVA
- CWilcoxon Mann Whitney
- DKruskal Wallis
71Which of the following would increase power and decrease Type II error? Select all that apply
- AIncrease sample size
- BHave a smaller effect size
- CDecrease your alpha (level of significance)
- DAdd appropriate control variables
72Which of the following are true about a linear model and its assumptions. If helpful, you can assume the model takes the form of y ~ x. Select all that apply
- AThe errors are homoscedastic
- BThere must be a significant relationship between your independent (x) variable and your dependent (y) variable
- CThe errors are normally distributed
- DIt is okay to have a hump shaped relationship between your independent (x) and dependent (y)
- EYour errors do not have to be normally distributed as long as your sample size is greater or equal to 30
- FThe correlation coefficient between x and y is the exact same value as the beta coefficient of x in the regression
73Fill in the following with either slope, rxy(sy/sx) , or rxy
In a linear model, the correlation coefficient is equal to [blank_start]rxy[blank_end]
the beta coefficient is the [blank_start]slope[blank_end] of the line and is equal to [blank_start]rxy(sy/sx)[blank_end]- Arxy
- Brxy(sy/sx)
- Cslope
74Non-parametric tests should be used for which of the following situations? Select all that apply.
- AWhen your data have unequal variances
- BWhen your sample is not randomly selected from the population
- CWhen your observations are not independent
- DWhen your data are not normally distributed and sample size < 30
Information
- Description
- Quiz on Stats Exam, created by Jennifer Fuller on 19/04/2019.
- Author
- Jennifer Fuller
- Language
- English
- Views
- 127
- Rating
- No ratings yet Rate this quiz