
Quiz
ADA
Create a free account to finish this quiz
Save your progress and see your final score.
Already have an account? Sign in
Questions in this quiz (88)
1A straight line can be defined by two things:
- AThe point where the line crosses the y axis (intercept)
- BThe slope or (gradient) of the line
- CIt's length
- DThe axis
2What is a regression coefficient?
- AThe intercept or point at which the the line crosses the y axis (x=0)
- BThe gradient or slope of the model, denoted as "b"
- CThe predictor variable
- DThe outcome variable
3What is the "predicted value"?
- AAnother name for the dependant variable
- BThe value of an outcome variable (dependent variable) based on specific values of the predictor variable (independent variable)
- CAnother name for the constant in the simple linear model
4The linear model can be expanded to include as many predictors as we like.
- ATrue
- BFalse
5__________________ is when we fit a linear model to our data and use it to predict values of an outcome variable (dependant variable) from one or more predictor variables (independent variable).
- ARegression Analysis
- BChi Squared Analysis
- CNHST - Null Hypothesis Significance testing
- DAlgebra
6Simple regression differs from multiple regression in that:
- AMultiple regression involves multiple constants.
- BSimple regression doesn't cause headaches
- CSimple regression and multiple regression are different names for the same thing
- DSimple regression and multiple regression are different in that in multiple regression there several predictors in the model whereas simple regression has only a single predictor variable.
7Residuals are
- ACrumbs left over after I eat a sandwich
- BThe differences between what the regression model predicts and the observed data
- CThe standard deviation
- DAnother name for the constant
8Dependant Variables are
- AAnother name for outcome variables
- BVariables that depend upon categorical measurement
- CThe same as indepedent variables
- DOrange juice
9Independent variables are
- APredictor variables
- BApple juice
- CInterval variables, ie variables independent from catergories
- DDemographic variables
10The residual sum of squares is
- AThe total sum of all squared residuals
- BA measure of how well a particular line fits the data, if the value is small the line is representative.
- CCan be calculated by adding the squared difference of each observed and predicted score
- DCan be compared to the sum of squares in that it shares the same underlying principle. The addition of all squared differences between observed and model predicted scores. Though in this case we are referring to the total error in a regression model.
11Ordinary Least Squares is
- AA method for estimating the parameters that define a regression line such that the differences between observed and predicted data are minimised
- BA method for optimising a chi square analysis
- CAnother name for a cross tabulation
12If the ordinary least squares finds the line of best fit for our regression model, why is it important to measure "goodness of fit"?
- AYou don't, if using the ordinary least squares it is not necessary to assess the goodness of fit.
- BBecause even though the model is the best available fit, it may still be a poor fit of the data
- CBecause it is always best to be conservative in statistics, sometimes it is important to use two different measures of the same thing.
- DOrdinary least squares is a measure of the fit of a basic model (the mean) against observed data, and as such is not a method by which to find the best fit for a regression model.
13What is the total sum of squares?
- AThe total sum of the squared difference between each observed score and each score predicted by our regression model
- BThe total sum of the squared difference between the observed scores and a model based on the mean, it is used as a baseline when to compare the residual sum of squares and establish a goodness of fit.
- CThe total number of variables in a regression model
- DAnother name for the mean
14How do we arrive at the "model sum of squares"?
- AThe model sum of squares is derived by the total sum of the squared difference between the observed scores and the mean. It represents the total amount of difference when the most basic model is applied to the data (the mean).
- BThe model sum of squares is derived by the total sum of the squared difference between the observed scores and the predicted scores. It is a measure of how well the regression line fits the data.
- CThe model sum of squares is derived by calculating the difference between the total sum of squares and the residual sum of squares. It is a measure of goodness of fit, how much better does the regression model fit the data than the mean.
15If the value of SS(M) (the model sum of squares) is large then we can say
- AThat the regression model is very different from using the mean to predict the outcome variable
- BThat the regression model is little different from using the mean to predict the outcome variable
16Choose all correct answers
R squared- AIs calculated by dividing the sum of squares for the model (SSm) by the total sum of squares (SSt)
- BRepresents the amount of variance in the outcome explained by the model (SSm) relative to how much variance there was to explain in the first place (SSt).
- CIs calculated by dividing the residual sum of squares (SSr) by the total sum of squares (SSt)
- DRepresents the amount of variance in the regression line (SSr) relative to how much variance there was to explain in the first place (SSt).
17The residual sum of squares is calculated by the total sum of squared differences between observed scores and those scores predicted by the model.
- ATrue
- BFalse
18R squared and multiple R squared refer to the same thing.
- ATrue
- BFalse
19We can use confidence intervals to compute the probability that:
- Aa population mean is equal to a specified value
- Ba sample mean is equal to a specified value
- Ca population mean is within a certain range of values
- Da sample mean is within a certain range of values
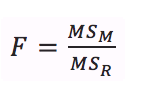
20An F-ratio is equal to the mean squares of the model divided by the residual mean squares. This gives us
- Aa measure of how much the model has improved the prediction of the outcome compared to the level of inaccuracy in the model.
- Ba measure of the amount of variance explained by the model relative to how much variance there was to explain in the first place.
21A good model should have a large F-ratio (more than 1) because the top of equation will be larger than the bottom. ie the improvement provided by the model will be greater than the inaccuracy in the model.
- ATrue
- BFalse
22Which of the following is TRUE?
- AThe value of a regression coefficient (b) represents the change in the outcome variable resulting from a unit of change in the predictor.
- BThe value of a regression coefficient (b) represents the change in the independent variable resulting from a unit of change in the dependent variable.
23If a regression coefficient is 0, what change can we expect in the outcome variable if the predictor variable is 1?
- ANo change
- BA change of 1 standard deviation units
- CNegative change, because multiplying the variable by zero will cause the outcome to have a smaller value.
24We can use a t-test to assess whether a regression coefficient is significantly different from 0. If we get a significant result then we can conclude that
- AWe have evidence to accept the null hypothesis
- BWe gain confidence in the null hypothesis
- CWe gain confidence in the hypothesis that the regression coefficient is significantly different from 0, therefore we must accept that the regression coefficient has no real effect of the dependant variable
- DWe gain confidence in the hypothesis that the regression coefficient is significantly different from 0 and that the independent variable contributes significantly to our ability to estimate values of the dependent variable.
25We can use a t-test to assess whether a regression coefficient is significantly different from 0. If we get a significant result then we can conclude that:
- AWe have evidence to accept the null hypothesis.
- BWe gain confidence in the null hypothesis.
- CWe gain confidence in the hypothesis that the regression coefficient is significantly different from 0, therefore we must accept that the regression coefficient has no real effect of the dependant variable.
- DWe gain confidence in the hypothesis that the regression coefficient is significantly different from 0 and that the independent variable contributes significantly to our ability to estimate values of the dependent variable.
26Like F, the t-statistic is also based on the ratio of explained variance (model) to unexplained variance (error)
- ATrue
- BFalse
27The standard error (SE) is the standard deviation of the sampling distribution of a statistic.
- ATrue
- BFalse
28A t-test tests if a regression coefficient is significantly different from zero (considering the standard error). The formula can be expressed as:
- AA. t = (B (observed) - B (expected)) divided by the standard error of B.
- BB. t = (B (observed)) divided by the standard error of B.
- CC. t = (B (expected)) divided by the standard error of B.
29A descriptive statistic can be used to make inferences about the data
- ATrue
- BFalse
30It is important to consider the effect of outliers with regression because
- AThey can affect the value of the constant making it smaller and larger.
- BThey can increase bias such that the regression coefficient will be larger, making it appear as though there is more of an effect.
- CThey can increase bias such that the regression coefficient will be smaller, thus making it appear that there is less of an effect.
- DThey can increase album sales.
31If a data point has a large residual then it is:
- Awell predicted by the regression line
- Bpossible that it is an outlier
- Ca t-statistic
- Dclose to the mean
32Unstandardised residuals are
- AMeasured in standard deviation units
- BMeasured in the same unit as the outcome variable
- CEasily interpreted across different models
33Choose the option that is NOT true
Standardised residuals:- AHave been converted to z-scores
- BAre measured in standard deviation units
- CCan be used to compare different models regardless of the original units of measurement
- DCalculated using a t-test
34Which of the following is NOT true.
- AStandardised residuals with an absolute value greater than 3.29 are cause for concern because in an average sample this value is unlikely to occur (0.01% of cases) ie 1 in 1000.
- BIf more than 1% of our sample cases have standardised residuals with an absolute value greater than 2.58 there is evidence that the level of error within our model is unacceptable (the model is a poor fit of the sample data).
- CIf more than 5% of our sample cases have standardised residuals with an absolute value greater than 1.96 there is evidence that the level of error within our model is unacceptable (the model is a poor fit of the sample data).
- D95% of all standardised residuals should be expected to occur with a range of -1 to 1 (standard deviation units)
35Select the options that are a legitimate means by which to identify outliers in a regression model?
- AInspecting the standardised residuals.
- BCook's distance (Cook's D)
- CIdentifying cases that have a large leverage. If no cases exert undue influence over the model then we would expect all of the leverage values to be close to the average value ((k+1)/n). Hoaglin and Welsch (1978) recommend investigating cases with values greater than twice the average whereas Stevens (2002) recommends using three times the average as a cut off point.
- DInspecting a scatterplot and removing data points that appear to be outside of the regression model
- EConducting a t-test, if the p value is <.05 then we can conclude that the data contains too many outliers
36What do Cook's D have in common?
- ACook's D and leverage are both a measure of the influence of an observed value over the model or predicted value.
- BCook's D and leverage were both designed by American statistician R. Dennis Cook
- CThey do not share anything in common and are measures of different statistical estimates.
37Cook and Weisberg have suggested that values of Cook's D great than ______ may be cause for concern.
- A1
- B.05
- C95%
- DValues greater than twice the average leverage
- EValues greater than three times the average leverage
38In the case of leverage what values are considered worthy of attention, or having undue influence on the model? Choose ALL correct answers
- AHoaglin and Welsch (1978) recommend using cases with values greater than twice the average.
- BCook and Weisberg (1982) recommend using cases with a value greater than 1
- CStevens (2002) recommends using three times the average as a cut-off point for identifying cases with undue influence.
- DHopkins and Jones (1997) recommend using cases with a value less than .05
39Select all good advice regarding diagnostic statistics for regression analysis. Select ALL correct responses.
- AOutliers create problems for regression analysis and should always be identified and removed.
- BAccording to Jackson (2007) Cook's D is the only diagnostic statistic worth considering, as others are too conservative
- CDiagnostics are tools that enable one to see how good or bad your model is in terms of fitting the data. They are a way of assessing your model. They are NOT, however, a way of justifying the removal of data points to effect some desirable change in the regression parameters [sic. statistics] (e.g. deleting a case that changes non-significant b value to a significant one). (Field, 2013)
- DIf a point is a significant outlier on Y, but it's Cook's distance is < 1, there is no real need to delete that point since it does not have a large effect on the regression analysis. However, one should still be interested in studying such points further to understand why they did not fit the model. (Stevens, 2002)
40Which of the following are assumptions of the linear model? Choose ALL correct responses.
- AThe assumption of additivity and linearity. That the outcome variable is, in reality, linearly related to all predictors.
- BThat the constant can be considered normal
- CIndependent errors. For any two observations in regression the residuals should be uncorrelated (independent).
- DThe optimal squares reduction must be met
- EStandardised block parity scores should be between -1.96 and 1.96
- FHomoscedasticity.
- GNormally distributed errors. Residuals in the model are random, normally distributed variables with a mean of 0.
- HPredictor variables must be normally distributed.
- IPredictors are uncorrelated with external variables. External variables are variables that are not included in the regression model. If these variables do correlate with the predictors, then the conclusions we draw from the model become unreliable because the other variable predicts the outcome as well.
- JError specificity. Residuals should be concrete and standardised.
41Again, which of the following are assumptions of the linear model? Check ALL correct responses.
- AAll normal values are significant. T-tests can be used to identify values that do not meet this criterion.
- BThe central limit assumption. Larger samples (>30) are necessary so that the sampling distribution is normal.
- CObject pronoun tasks are ratified.
- DAll predictor variables must be quantitative or categorical (with two categories).
- EPredictor variables must be regressive.
- FNo perfect multicollinearity. If your model has more than one predictor then there should be no perfect linear relationship between two or more predictors. Thus predictor variables should not correlate too highly.
- GNon-zero variance. The predictors should have some variation in value.
- HThe outcome variable must be quantitative, continuous and unbounded.
- AAll normal values are significant. T-tests can be used to identify values that do not meet this criterion.
42What is Homoscedasticity?
- AThe assumption that the variance of residuals is non-zero, i.e that residuals tend to differ from zero. As a rule of thumb, the mean residual should be >.05
- BThe assumption that residuals of the predictor variables have similar variances. i.e the spread of residuals should be fairly constant along the regression line.
- CThe assumption that all variables are taken from the same population.
- DA fabricated term, the correct term is Heteroscedasticity.
43An example of deviation from linearity assumption would be a curvilinear spread of the data
- ATrue
- BFalse
44Peter de Heus suggests that:
- AOutliers on the dependent variable should be identifies using standardised residuals (>3 or <-3)
- BOutliers on the independent variable can be identified using leverage. He suggests we follow stevens (2002) and use a cut of 3x the average leverage. 3(k+1)/N
- COutliers are uninteresting and overrules Field
- DOften outliers have little influence on results, but sometimes removal of an outlier leads to a very different regression outcome, usually when a case is outlying on both Y and X variables. In these cases we use Cook's D (>1)
45Outliers can be identified in SPSS:
- Aon the Y axis with standardised residuals (greater than 3)
- Bon the X axis with leverage greater than 3(k+1)/N
- CInfluential points use Cook's D > than 1
- DMean values to identify bias
46Removing outliers can have consequences for our conclusion, however we must also ask that if changing a conclusion based on a small number of outliers is premature.
- ATrue
- BFalse
47T-tests are used when comparing two means
- ATrue
- BFalse
48Independent means (groupwise) t-test
- ACompares two groups on one interval variable
- BOne binary variable, and one interval variable
- CCompares two interval variables within the same group
- DTwo interval variables
49Dependent means (pairwise) t-test
- ACompares two groups on one interval variable
- BOne binary variable, and one interval variable
- CCompares two interval variables within the same group
- DTwo interval variables
50Groupwise computation of t. t-statistic generally gets more different from zero when (more sig.)
- AThe difference between the two means approaches zero
- BThe variation within groups gets smaller
- CThe sample size gets smaller
51Standard deviations are pooled when conducting
- AIndependent/Groupwise t-tests -
- BDependent/Pairwise t-tests -
- CIndependent/Pairwise t-tests -
- DDependent means/Groupwise t-tests -
52Groupwise t-tests assumptions include:
- ANormality. Observations (errors) on Y are normally dis. Though this does not matter much as t is robust (unless very small N). WARNING: Tests for normality using small N are unlikely to work as the test has very little power.
- BHomogeneity of variance. Population variances of errors on Y are equal in both groups. Use Levene test.
- CT test is robust unless we have both unequal group sizes (N:N >1.5 times) and heterogenous variances.
- DIndependence. Observations (or errors) on Y are independent of each other.
- EThese assumptions apply only to the sample, not the population
53We measure effect size on groupwise (independent) t-test can be measured using
- APearson's correlations. Benchmarks = .10 small, .30 medium, .50 large
- BStandardised difference measures. Benchmarks = .20 small, .50 medium, .80 large.
Dividing the difference between means by a standard deviation. Usually the pooled SD though a variation (Glass' delta) uses the control SD. - CStandardised between means sample deviation. Benchmark > 1.96.
Dividing the difference between means by a standard deviation. Usually the pooled SD though a variation (Glass' delta) uses the control SD. - DOrion's Y. Benchmarks = .10 small, .3 medium, .5 large
54Pairwise t-test is used when
- ARepeated measures (E.g pretest and post test)
- BComparing means of two interval variables within ONE group
- CComparing means of one interval variables within TWO groups
55The possibility of correlated observations is
- AA problem because it is a direct violation of independence assumption.
- BPotential. Pared observations allow us to compute difference scores for each pair (D=Y1-Y2). Can be used to eliminate all systematic differences between pairs from error>less error>(Often not always) more statistical power.
56A strong correlation between the two measures in a pairwise t test leads to more statistical power.
- ATrue
- BFalse
57If we keep total number of observations constant (2N), pairwise df =
- ACould mean less power than groupwise tests
- BN-1
- C2N-2
58In pairwise t-tests t will get larger when
- Amean difference gets larger
- BSD gets smaller
- CN gets smaller
59Which of the following are correct?
- AAn independent T test is a test between two unrelated samples. If you test 30 males and 30 females on a memory experiment, there isn't any particular reason why you would expect the male scores to relate to the females. Its generally used if you're getting two different groups to perform the same test, one time.
- BA dependent T test is a test between two samples when you do expect there to be a relationship between the two. If you test 30 males doing an IQ test before and after drinking a bottle of wine, you would still expect their scores on both occasions to be correlated (high IQ people are generally always going to score higher, and low people will generally still be lower, despite any changes that drinking alcohol might have).
- CAn dependent T test is a test between two unrelated samples. If you test 30 males and 30 females on a memory experiment, there isn't any particular reason why you would expect the male scores to relate to the females. Its generally used if you're getting two different groups to perform the same test, one time.
- DAn independent T test is a test between two samples when you do expect there to be a relationship between the two. If you test 30 males doing an IQ test before and after drinking a bottle of wine, you would still expect their scores on both occasions to be correlated (high IQ people are generally always going to score higher, and low people will generally still be lower, despite any changes that drinking alcohol might have).
60Cross validation
- AAn important step in assessing the generalisation of a regression model.
- BCan be calculated by randomly splitting the data in half, computing a regression equation on both halves of the data and comparing the resulting models.
- CIf the regression model is applied to a different sample and there is a severe drop in it's predictive power the the model can be said to generalise.
- DCan be measured using the Adjusted R squared
61When it comes to sample size in regression how much is enough? Choose the BEST "rule of thumb" as suggested by Field (2013)
- ASample size does not matter much
- B10 cases of data for every predictor in the model
- C15 cases of data for every predictor in the model
- DUse a the program G*Power or more broadly speaking if you expect to find a large effect then the sample size of 77 will always suffice (up to 20 predictors) and if there are fewer predictors then you can afford to have a smaller sample.
If you are expecting to find a medium effect then a sample size of 160 will always suffice (up to 20 predictors), you should always have a sample size above 55, and with 6 or fewer predictors you will be fine with 100.
If you are expecting to find a small effect size then just don't bother unless you are willing to collect hundreds (if not over 1000) of cases of data.
Simply put refer to pp 313.
62When sample size increases:
- AVariance increases
- BThe mean increases
- CThe standard error tends to increase
- DStatistical power increases
- EError (in general) decreases
63Predictor variables should be chosen. Choose all the correct responses.
- ABased on a sound theoretical rationale
- BBased on well-conducted past research that has demonstrated past research
- CHundreds should be chosen, the more predictors the more statistical power
- DMore predictor variables is important to uphold the normality assumption because of the central limit theorm
64When Independent variables are well correlated the order of variable entry has very little effect on parameter estimates.
- ATrue
- BFalse
65Select the correct response(s)
- AIn hierarchical regression predictors are selected based on past research and the researcher decides in which order to enter the predictors into the model.
- BIn stepwise regression decisions about the order in which predictors are entered are based on purely mathematical criterion.
- CIn hierarchical regression decisions about the order in which predictors are entered are based on purely mathematical criterion.
- DIn stepwise regression predictors are selected based on past research and the researcher decides in which order to enter the predictors into the model.
66Forced entry (or Enter in SPSS)
- AIs a type of hierarchical and as such the researcher must choose which order to enter the predictors into the model.
- BIs a type of stepwise regression and as such the order in which predictors are entered into the model are based purely of mathematical criterion.
- CInvolves no decision (mathematical or researcher) about which order predictor variables are placed.
67Stepwise regression is a troublesome method because:
Choose ALL correct- AIt is influenced by random variation (and can often take advantage of this variation).
- BIt takes many of the important methodological decisions out of the hands of the researchers.
- CIt is potentially useful for exploratory model building.
- DAll predictors are forced into the model simultaneously
68Which of the following describes forward selection method of multiple regression:
- AAn initial model is defined that contains only the constant. The computer the searches for the predictor that best predicts the outcome (looking for the highest simple correlation with the outcome). If this predictor also has a significant effect then it is retained and the computer searches for a second predictor. The choice of the second predictor is the variable with the highest semi-partial correlation with the outcome. ie the variable that can explain the largest proportion of variance not accounted for by the first variable. If this second variable is found to be significant it is then added to the model and another predictor is considered and so forth.
- BThe computer begins by placing all predictors in the model and then calculating the contribution of each one by looking at the significance value of the t-test. The significance value is compared against a removal criterion and if the variable is found not to make a significant contribution to the model it is removed from the model and the model is re-estimated for the remaining predictors. The contribution of the remaining predictors is then reassessed.
69Which of the following describes the backwards method of stepwise regression:
- AThe computer begins by placing all predictors in the model and then calculating the contribution of each one by looking at the significance value of the t-test. The significance value is compared against a removal criterion and if the variable is found not to make a significant contribution to the model it is removed from the model and the model is re-estimated for the remaining predictors. The contribution of the remaining predictors is then reassessed.
- BAn initial model is defined that contains only the constant. The computer the searches for the predictor that best predicts the outcome (looking for the highest simple correlation with the outcome). If this predictor also has a significant effect then it is retained and the computer searches for a second predictor. The choice of the second predictor is the variable with the highest semi-partial correlation with the outcome. ie the variable that can explain the largest proportion of variance not accounted for by the first variable. If this second variable is found to be significant it is then added to the model and another predictor is considered and so forth.
70What is the difference between backward elimination method of multiple regression?
- AForward stepwise regression is a type of stepwise regression, and thus there is no "difference" between these terms.
- BThese are different terms for the same method.
- CStepwise regression is the same as forward selection except that each time a predictor is added to the equation, a removal test is made for the least useful predictor. Thus the regression equation is being constantly reassessed to see whether any redundant predictors can be removed.
71Which of the following does Field suggest when choosing stepwise regression. Choose all correct.
- AStepwise regression is best avoided except for exploratory model building.
- BUse the backward elimination method rather than the forward selection method. Because forward selection is more likely to exclude predictors involved in suppressor effects.
- CIt is advisable to cross-validate your model by splitting the data.
- DAs a general rule, known predictors (from other research should be entered into the model first in order of their importance in predicting the outcome.
72Multicollinearity occurs when
- AThere is a strong correlation between two or more predictor variables.
- BThere is a no correlation between predictor variables.
- CThere is evidence to suggest two regression lines are bisecting.
- DThere is no evidence to suggest two regression lines are bisecting.
73Multicollinearity is
- AWhen we are using regression to concurrently deduce two regression lines.
- BWhen the tolerance is to close to the mean value (Morgan's test)
- CMeasured using Tolerance (1-Rsquared) . Lower scores are more serious <.10
- DMeasured using Variance Inflation Factor (VIF = 1/Tolerance = 1/(1-Rsquared). Higher scores are more serious >10
74Multicollinearity is
- AVery rare because normally correlations between psychological variables are not very high.
- BMostly the consequence of the often made mistake: taking both the total scale and the sub scales as predictors.
- CCan be remedied by combining predictors into one variable
- DCan be remedied by removing one of the predictors.
75As collinearity increases
- ASo to does the standard errors of the regression coefficients (b), therefore the b is less likely to be representative of the population. As collinearity increases so do the standard errors of the b coefficients, thus these b's are more variable across samples and our b is less likely to represent the population.
- BIt limits the size of R.
- CMulticollinearity between predictors makes it difficult to asses the individual importance of a predictor.
76A scatterplot is used to measure
- AFrequencies of variables
- BRelationships between two variables.
- CCategorical data
77When performing a correlation on a small data set with a large number of tied ranks the best test to choose is:
- APearson's r
- BSpearman's rho
- CKendall's tau
- DCohen's d
78If our data appears to have a large number of outliers we should use which correlation analysis?
- ASpearman's rho
- BPearson's r
79What might you perform one of the following?
Trim the data - Delete a certain amount of scores from the extremes
Winsorising - Substitute outliers with the highest values that is not an outlier
Analyse with robust methods - Usually involves bootstrapping.
Transform the data - This involves applying a mathematical function to the scores to try to correct any problems with them.
Abbreviated with the handy acronym "TWAT"- AThey are all methods of reducing bias
- BThey are all methods of making analyses more robust to assumptions of homoscedaticity
- CThey are all methods of increasing statistical power
- DThey are all methods of increasing effect size
80In what kind of situation might it be important to apply a transformation to a data set?
- AWhen sample sizes are comparatively large (n > 100)
- BWhen p values are very close to < .05
- CWhen assumptions of normality or linearity might be violated
- DAlways, transformations make our results more reliable
81How should we look for potential problems with linearity or homoscedasticity?
- AHomoscedasticity and linearity can be detected using a histogram to display the distribution of the data. If the assumption of linearity and homoscedasticity hold true then there should be minimal deviation from a normal type distribution.
- BHomoscedasticity and linearity can be investigated by looking at a P-P plot. If the assumption of linearity and homoscedasticity hold true then there should be minimal deviation from the line.
- CA scatterplot of the values of residuals against the values of the outcome predicted by the model. If the assumption of linearity and homoscedasticity hold true then there should be no systematic relationship between the errors in the model and what the model predicts.
- DA zpred vs zresid scatterplot. If the assumption of linearity and homoscedasticity hold true then there should be no systematic relationship between the errors in the model and what the model predicts.
82Which of the following tests is the appropriate test for heteroscedasticity?
- ACook's d
- BNHST - Null Hypothesis Significance Testing.
- CKolmogorov-Smirnov test
- DLevene's test
83Is Levene's test worthwhile?
- AYes, as visual inspection of scatterplots is unreliable and can differ between investigators.
- BNot really, because when you have violated the assumption of homoscedasticity it only matters if you have unequal group sizes. If you do not have unequal group sizes this assumption is pretty much irrelevant, and can be ignored.
- CNot really, Levene's test works very well when you have equal group sizes and large samples (when it doesn't matter so much if you have violated the assumption) and don't work so well with unequal groups sizes and smaller samples (which is exactly when it does matter).
- DNot really, there are adjustments that can be made to correct for violations of the homoscedasticity assumption. In most cases if there has been a violation then corrections are made, and if you haven't then a correction is not made. In other words we may as well always perform such adjustments and forget about the assumption altogether.
84Which of the following could be considered "data trimming"
- AAdding data points at the opposite extreme to account for the outlier.
- BSubstituting the outliers with the highest value that is not an outlier
- CDeleting the cases that could be considered outliers.
- DDeleting a certain percentage of data points from the top and bottom extremes of the set.
- EDeleting data points that are a certain number of standard deviations away from the mean.
- FApplying a mathematical function to the scores to try and correct any problems with them.
85In what circumstance is it permissible to trim an outlier?
- AWhen it exerts undue influence on the data/model etc.
- BOnly if you have good reason to believe that this case is not from the population you intended to sample.
- CWhen it falls more the 3 SD away from the mean.
- DBefore performing a robust test.
86When all options are open to a researcher which is the BEST methods for reducing bias in a model?
- AUsing a robust test.
- BTrimming the data
- CWinsorising
- DTransform the data
87There is a fundamental problem with standard-deviation based trimming: The mean and standard deviation are both highly influenced by outliers; therefore, if you have outliers in the data the criterion you use to reduce their impact has already been biased by them.
- ATrue
- BFalse
88A test can be considered robust if
- AIt does not rely on the assumption of normally distributed data, i.e non-parametric tests.
- BIt uses bootstrapping
- CIt draws on the use of a trimmed mean or M estimator. (ie uses trimming)
- DIt relies of assumptions of homoscedasticity, linearity and normality.
Information
- Description
- Starts from week 4 readings.
- Author
- Dan Myles
- Language
- English
- Views
- 3
- History
- Created on 23 Feb 2015 · updated on 3 Feb 2018
- Rating
- No ratings yet Rate this quiz