
26472091
Description
Question 1
Question
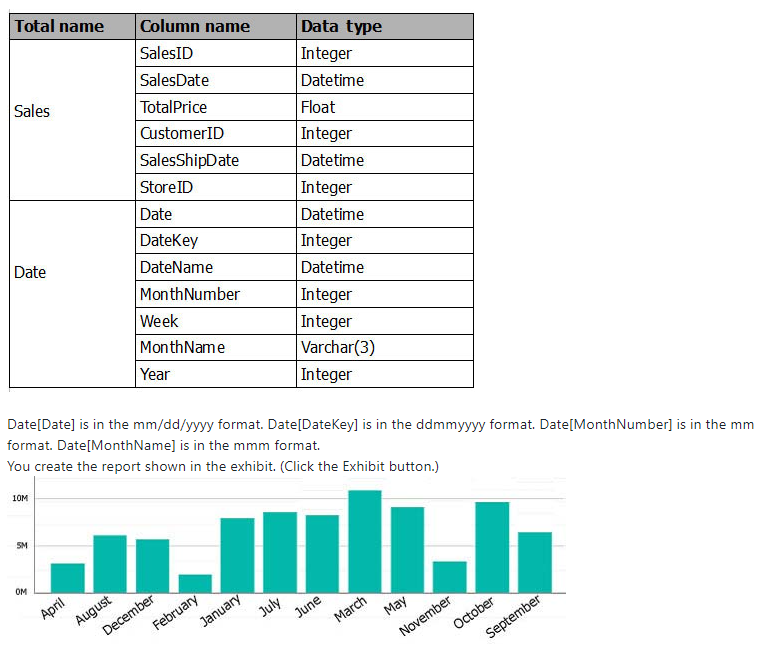
You are creating a report in Power BI Desktop.
You are consuming the following tables.
You need to ensure that the months appear in the order of the calendar.
How should you sort the MonthName column?
Image:
Image (binary/octet-stream)
Answer
-
A. by MonthNumber
-
B. ascending
-
C. descending
-
D. by DateKey
Question 2
Question
DRAG DROP -
From Power BI service, you publish an app that contains one dashboard and one report. Q&A is enabled on the dashboard.
In Q&A, a user types the query count of clients and fails to receive any results. The user then types the query count of subscribers and receives the expected results.
You need to ensure that the user can use both queries to receive the same results.
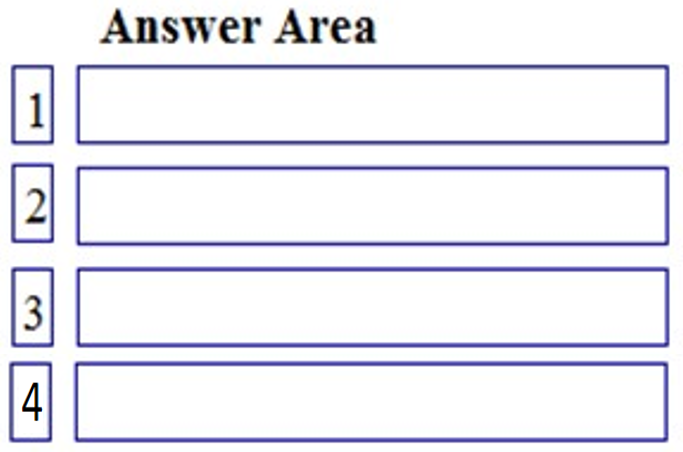
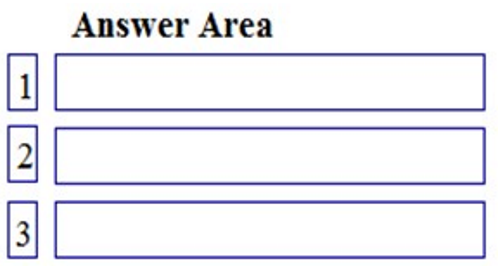
Which four actions should you perform in sequence? To answer, move the appropriate actions from the list of actions to the answer area and arrange them in the correct order.
Select and Place:
Image:
Image (binary/octet-stream)
Answer
-
Delete and publish the app
-
Enable & config data class for dashboard
-
Edit the dashboard settings from PBI.com
-
Publish the report to app workspaces
-
Edit the synonyms
-
Update the app from powerbi.com
Question 3
Question
HOTSPOT -
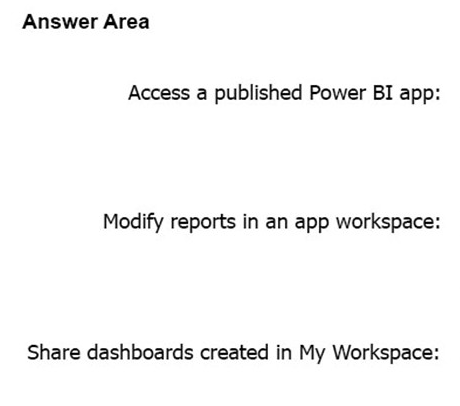
Your company plans to use Power BI for 20 users in the sales department. The users will perform the following tasks:
-> Access a published Power BI app.
Modify reports in an app workspace.
-> Share dashboards created in My Workspace.
You need to identify which Power BI licenses are required for the tasks. The solution must use the Power BI (free) license, whenever possible.
Which license should you identify for each task? To answer, select the appropriate options in the answer area.
NOTE: Each correct selection is worth one point.
Hot Area:
Image:
Image (binary/octet-stream)
Answer
-
Power BI Free
-
Power BI PRO
-
Power BI Free
-
Power BI PRO
-
Power BI Free
-
Power BI PRO
Question 4
Question
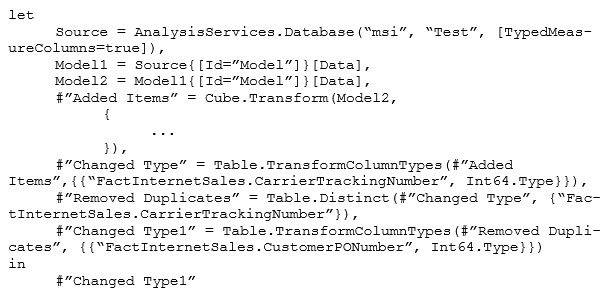
You have a Microsoft SQL Server Analysis Services (SSAS) cube that contains historical data.
In Power BI Desktop, you have the following query for the cube.
The query retrieves 25,499 records.
When you check the data warehouse that is the source of the cube, you discover that there are 26,423 records.
You need to ensure that the query retrieves all 26,423 records.
What should you do?
Image:
Xmlfile 80 1 (image/png)
Answer
-
A. From Query Editor, refresh all the data.
-
B. Change the query to use Live connection mode.
-
C. Delete the Remove Duplicates step.
-
D. Add an Unpivot Columns step.
Question 5
Question
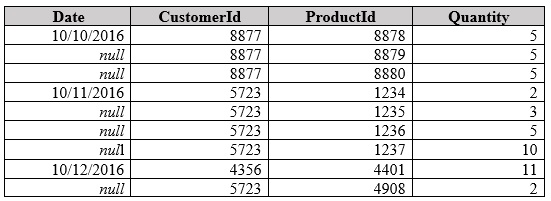
You have a query that retrieves sales data. A sample of the data is shown in the following table.
You need to ensure that the values in the Date column contain a date. Null values must be replaced with the date from the previous row.
What should you click on the Transform tab in Query Editor?
Image:
Xmlfile 81 1 (image/png)
Answer
-
A. Format, and then Clean
-
B. Date, and then Earliest
-
C. Fill, and then Down
-
D. Replace Values, and then Replace Errors
Question 6
Question
Your organization has a Microsoft Office 365 subscription.
When the users attempt to access the Power BI Service, they receive the error message shown in the exhibit. (Click the Exhibit button.)
You need to ensure that all the users can access the Power BI service.
What should you do first?
Image:
Xmlfile 82 1 (image/jpeg)
Answer
-
A. From the Microsoft Azure Active Directory admin center, assign a Power BI (free) license to each user.
-
B. From the Power BI Admin portal, modify the Tenant settings.
-
C. From Microsoft Azure PowerShell, run the Set-MsolCompanySettings cmdlet.
-
D. From the properties of each dashboard, modify the Share dashboard settings.
Question 7
Question
You have the following two queries in Power BI Desktop:
-> A query named Query1 that retrieves a table named SMB_Customers from a Microsoft SQL Server database
-> A query named Query2 that retrieves a table named Enterprise_Customers from an Oracle database
Both tables have the same columns.
You need to combine the data from SMB_Customers and Enterprise_Customers.
Which command should you use?
Answer
-
A. Combine Files
-
B. Merge Queries
-
C. Merge Columns
-
D. Append Queries
Question 8
Question
You are creating a Power BI Desktop report that has several bar charts and a date slicer.
You need to create a slide show that can be viewed from the Power BI service. Each slide must display the charts filtered for a different year.
What should you do before you publish the report?
Answer
-
A. Configure report level filters, and then create groups that use the List group type.
-
B. Configure drillthrough filters for each bar chart, and then select Selection Pane.
-
C. Filter the bar charts by using the slicer, and then create bookmarks.
-
D. Configure page level filters, and then create groups that use the Bin group type.
Question 9
Question
DRAG DROP -
You create a report in Power BI Desktop.
You need to embed the report into a Microsoft SharePoint Online site.
Which three actions should you perform in sequence? To answer, move the appropriate actions from the list of actions to the answer area and arrange them in the correct order.
Select and Place:
Image:
Image (binary/octet-stream)
Answer
-
Pin a visualization
-
Pin a live page
-
Publish the report to Power BI service
-
Obtain an embed link for SharePoint
-
Add a webpart to a page
Question 10
Question
You have a Power BI app named App1. The privacy for the App1 app workspace is set to Private.
A user named User1 reports that App1 does not appear in the My organization AppSource. App1 appears in the My organization AppSource for your account.
You need to ensure that User1 sees App1 from the My organization AppSource.
What should you do?
Answer
-
A. From the app workspace, click Update app, configure the Access setting, and then click Update app.
-
B. From the app workspace, share the dashboard.
-
C. From the app workspace settings, add a member.
-
D. From the app workspace, click Update app, configure the Content settings, and then click Update app.
Question 11
Question
You have a sales report in an app workspace. The report displays a map of sales by location and a bar chart of sales by year. The report has a slicer to filter the data by year.
You need to create a dashboard that contains visualizations. The solution must ensure that you can use the slicer to filter the data by year.
What should you do?
Answer
-
A. Pin each visualization to the dashboard, and then add a web content tile.
-
B. Add a page level filter, and then pin each visualization to the dashboard.
-
C. Publish the app workspace.
-
D. Pin the report as a live page.
Question 12
Question
A data analyst publishes several Power BI visualizations to a blog.
You discover that some of the visualizations contain data that is considered private by your company.
You need to prevent the visualizations from being published to the blog.
What should you do?
Answer
-
A. From the Power BI Admin portal, disable the Publish to web setting.
-
B. From the Power BI settings, delete the embedded codes.
-
C. From the Power BI Admin portal, disable the Share content with external users setting.
-
D. From the dashboard settings, modify the Share dashboard settings.
Question 13
Question
You have an app workspace that contains two datasets named dataset1 and dataset2. Dataset1 connects to a Microsoft Azure SQL database. Dataset2 connects to a Microsoft Excel file stored in Microsoft OneDrive for Business.
You create a report named Report1 that uses dataset1.
You pin Report1 to a dashboard named Dashboard1.
You publish the app workspace to all the users in your organization.
You need to delete dataset2 from the app workspace.
What should you do first?
Answer
-
A. Delete Dashboard1.
-
B. Delete Report1.
-
C. Unpublish the app.
-
D. Configure the refresh settings for Dataset2.
Question 14
Question
You create a report in the Power BI service.
You plan to provide external users with access to the report by publishing the report to a public blog.
You need to ensure that the report in the blog post will be updated as the data is refreshed.
What should you do in the Power BI service?
Answer
-
A. Publish the app workspace to the entire organization. In the blog post, use the URL of the app workspace.
-
B. Share the report. In the blog post, use the URL of the dashboard.
-
C. Publish the report to the web. In the blog post, use the embed code URL.
-
D. In the blog post, use the URL of the report.
Question 15
Question
In the Power BI service, you create an app workspace that contains several dashboards.
You need to provide a user named user1@contoso.com with the ability to edit and publish dashboards.
What should you do?
Answer
-
A. Modify the members of the app workspace.
-
B. Configure security for the dataset used by the app.
-
C. Share the dashboard, and then modify the Access settings of the dashboard.
-
D. From the app workspace, click Update app, and then configure the Access settings.
Question 16
Question
You embed a Power BI report in a Microsoft SharePoint Online page.
A user named User1 can access the SharePoint Online page, but the Power BI web part displays the following error message: “This content isn’t available.â€
User1 is unable to view the report.
You verify that you can access the SharePoint Online page and that the Power BI report displays as expected.
You need to ensure that User1 can view the report from SharePoint Online.
What should you do?
Answer
-
A. Publish the app workspace.
-
B. Share the dashboard in the app workspace.
-
C. Edit the settings of the Power BI web part.
-
D. Modify the members of the app workspace.
Question 17
Question
You have a Power BI model that contains the following two tables:
-> Assets (AssetID, AssetName, Purchase_DateID, Value)
-> Date (DateID, Date, Month, Week, Year)
The tables have a relationship. Date is marked as a date table in the Power BI model.
You need to create a measure to calculate the percentage that the total assets value increased since one year ago.
Which DAX formula should you use?
Answer
-
A. (sum(Assets[Value]) - CALCULATE(sum(Assets[Value]), SAMEPERIODLASTYEAR('Date'[Date])))/CALCULATE(sum(Assets[Value])), SAMEPERIODLASTYEAR('Date'[Date])))
-
B. CALCULATE(sum(Assets[Value]), SAMEPERIODLASTYEAR('Date'[Date]))/ (sum(Assets[Value])
-
C. CALCULATE(sum(Assets[Value]),DATESYTD(('Date'[Date]))/ (sum(Assets[Value])
-
D. (sum(Assets[Value]) - CALCULATE(sum(Assets[Value]), SAMEPERIODLASTYEAR('Date'[Date]))/
Question 18
Question
Note: This question is part of a series of questions that present the same scenario. Each question in the series contains a unique solution that might meet the stated goals. Some question sets might have more than one correct solution, while others might not have a correct solution.
After you answer a question in this section, you will NOT be able to return to it. As a result, these questions will not appear in the review screen.
You have a Power BI model that contains two tables named Sales and Date. Sales contains four columns named TotalCost, DueDate, ShipDate, and OrderDate.
Date contains one column named Date.
The tables have the following relationships:
-> Sales[DueDate] and Date[Date]
-> Sales[ShipDate] and Date[Date]
-> Sales[OrderDate] and Date[Date]
The active relationship is on Sales[DueDate].
You need to create measures to count the number of orders by [ShipDate] and the orders by [OrderDate]. You must meet the goal without duplicating data or loading additional data.
Solution: You create a calculated table. You create a measure that uses the new table.
Does this meet the goal?
Answer
-
Yes
-
No
Question 19
Question
Note: This question is part of a series of questions that present the same scenario. Each question in the series contains a unique solution that might meet the stated goals. Some question sets might have more than one correct solution, while others might not have a correct solution.
After you answer a question in this section, you will NOT be able to return to it. As a result, these questions will not appear in the review screen.
You have a Power BI model that contains two tables named Sales and Date. Sales contains four columns named TotalCost, DueDate, ShipDate, and OrderDate.
Date contains one column named Date.
The tables have the following relationships:
-> Sales[DueDate] and Date[Date]
-> Sales[ShipDate] and Date[Date]
-> Sales[OrderDate] and Date[Date]
The active relationship is on Sales[DueDate].
You need to create measures to count the number of orders by [ShipDate] and the orders by [OrderDate]. You must meet the goal without duplicating data or loading additional data.
Solution: You create measures that use the CALCULATE, COUNT, and FILTER DAX functions.
Does this meet the goal?
Answer
-
Yes
-
No
Question 20
Question
Note: This question is part of a series of questions that present the same scenario. Each question in the series contains a unique solution that might meet the stated goals. Some question sets might have more than one correct solution, while others might not have a correct solution.
After you answer a question in this section, you will NOT be able to return to it. As a result, these questions will not appear in the review screen.
You have a Power BI model that contains two tables named Sales and Date. Sales contains four columns named TotalCost, DueDate, ShipDate, and OrderDate.
Date contains one column named Date.
The tables have the following relationships:
-> Sales[DueDate] and Date[Date]
-> Sales[ShipDate] and Date[Date]
-> Sales[OrderDate] and Date[Date]
The active relationship is on Sales[DueDate].
You need to create measures to count the number of orders by [ShipDate] and the orders by [OrderDate]. You must meet the goal without duplicating data or loading additional data.
Solution: You create two copies of the Date table named ShipDate and OrderDateGet. You create a measure that uses the new tables.
Does this meet the goal?
Answer
-
Yes
-
No
Question 21
Question
Note: This question is part of a series of questions that present the same scenario. Each question in the series contains a unique solution that might meet the stated goals. Some question sets might have more than one correct solution, while others might not have a correct solution.
After you answer a question in this section, you will NOT be able to return to it. As a result, these questions will not appear in the review screen.
You have a user named User1. User1 is a member of a security group named Contoso PowerBI.
User1 has access to a workspace named Contoso Workspace.
You need to prevent User1 from exporting data from the visualizations in Contoso Workspace.
Solution: From the Microsoft Office 365 Admin center, you remove User1 from the All Users security group.
Does this meet the goal?
Answer
-
Yes
-
No
Question 22
Question
Note: This question is part of a series of questions that present the same scenario. Each question in the series contains a unique solution that might meet the stated goals. Some question sets might have more than one correct solution, while others might not have a correct solution.
After you answer a question in this section, you will NOT be able to return to it. As a result, these questions will not appear in the review screen.
You have a user named User1. User1 is a member of a security group named Contoso PowerBI.
User1 has access to a workspace named Contoso Workspace.
You need to prevent User1 from exporting data from the visualizations in Contoso Workspace.
Solution: From the Microsoft Office 365 Admin center, you modify the properties of Contoso PowerBI.
Does this meet the goal?
Answer
-
Yes
-
No
Question 23
Question
Note: This question is part of a series of questions that present the same scenario. Each question in the series contains a unique solution that might meet the stated goals. Some question sets might have more than one correct solution, while others might not have a correct solution.
After you answer a question in this section, you will NOT be able to return to it. As a result, these questions will not appear in the review screen.
You have a user named User1. User1 is a member of a security group named Contoso PowerBI.
User1 has access to a workspace named Contoso Workspace.
You need to prevent User1 from exporting data from the visualizations in Contoso Workspace.
Solution: From the PowerBI setting, you modify the Developer Settings.
Does this meet the goal?
Answer
-
Yes
-
No
Question 24
Question
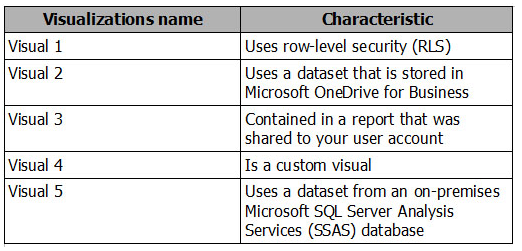
You plan to embed multiple visualizations in a public website.
Your Power BI infrastructure contains the visualizations configured as shown in the following table.
Which two visualizations can you embed into the website? Each correct answer presents a complete solution.
NOTE: Each correct selection is worth one point.
Image:
Image (binary/octet-stream)
Answer
-
A. Visual 1
-
B. Visual 2
-
C. Visual 3
-
D. Visual 4
-
E. Visual 5
Question 25
Question
You have a workspace that contains 10 dashboards. A dashboard named Sales Data displays data from two datasets. You discover that users are unable to find data on the dashboard by using natural language queries.
You need to ensure that the users can find data by using natural language queries.
What should you do?
Answer
-
A. From the settings of the workspace, modify the Language Settings.
-
B. From the Sales Data dashboard, set the dashboard as a Favorite.
-
C. From the properties of the datasets, modify the Q&A and Cortana settings.
-
D. From the properties of the dashboard, modify the Q&A settings.
Question 26
Question
DRAG DROP -
You have a Microsoft Excel workbook that contains two tables.
From Power BI, you create a dashboard that displays data from the tables.
You update the tables each day.
You need to ensure that the visualizations in the dashboard are updated daily.
Which three actions should you perform in sequence? To answer, move the appropriate actions from the list of actions to the answer area and arrange them in the correct order.
NOTE. More than one order of answer choices is correct. You will receive credit for any of the correct orders you select.
Select and Place:
Image:
Image (binary/octet-stream)
Answer
-
Install on-prem data gateway (personal)
-
Config gateway con settings for dataset
-
Add subscriptions for the reports
-
Install Power BI Desktop
-
Config schedule refresh settings for DS
Question 27
Question
You manage a Power BI model that has two tables named Sales and Product.
You need to ensure that a sales team can view only data that has a CountryRegionName value of Unites States and a ProductCategory value of Clothing.
What should you do from Power BI Desktop?
Answer
-
A. Add the following filters to a report. CountryRegionName is United States ProductCategory is Clothing
-
B. From Power BI Desktop, create a new role that has the following filters. [CountryRegionName] = "United States" [ProductCategory] = "Clothing"
-
C. Add the following filters in Query Editor. CountryRegionName is United States ProductCategory is Clothing
-
D. From Power BI Desktop, create a new role that has the following filter. [CountryRegionName] = "United States" && [ProductCategory] = "Clothing"
Question 28
Question
You create a report in the Power BI service that displays the following visualizations:
-> A KPI that displays the count of customers
-> A table that displays the count of customers by country
-> A line chart that displays the count of customers by year
You need to receive an alert when the total number of customers reaches 10,000.
What should you do first?
Answer
-
A. Pin the line chart to a dashboard.
-
B. Pin the KPI to a dashboard.
-
C. Embed the report into a Microsoft SharePoint page.
-
D. Pin the report to a dashboard.
Question 29
Question
You have a Power BI dashboard that displays different visualizations of company sales.
You enable Q&A on the dashboard.
You need to provide users with sample questions that they can ask when using Q&A.
Which settings should you modify from the Power BI Settings?
Answer
-
A. Subscriptions
-
B. Workbooks
-
C. Dashboards
-
D. Datasets
Question 30
Question
You have an app workspace named Retail Store Analysis in the Power BI service.
You need to manage the members that have access to the app workspace using the least amount of administrative effort.
What should you do?
Answer
-
A. From the Office 365 Admin center, click Users.
-
B. From the Power BI Admin portal, click Tenant settings.
-
C. From the Power BI Admin portal, click Usage metrics.
-
D. From the Office 365 Admin center, click Groups.
Question 31
Question
You have a Microsoft Excel spreadsheet that contains a table named Sales.
You need to add the Sales table to a Power BI dashboard as a tile.
How should you configure the tile?
Answer
-
A. From the Power BI service, import the data from the Excel workbook.
-
B. From Excel, publish the workbook to the Power BI service.
-
C. From the Power BI tab in Excel, pin the table.
-
D. From the Power BI service, upload the Excel workbook.
Question 32
Question
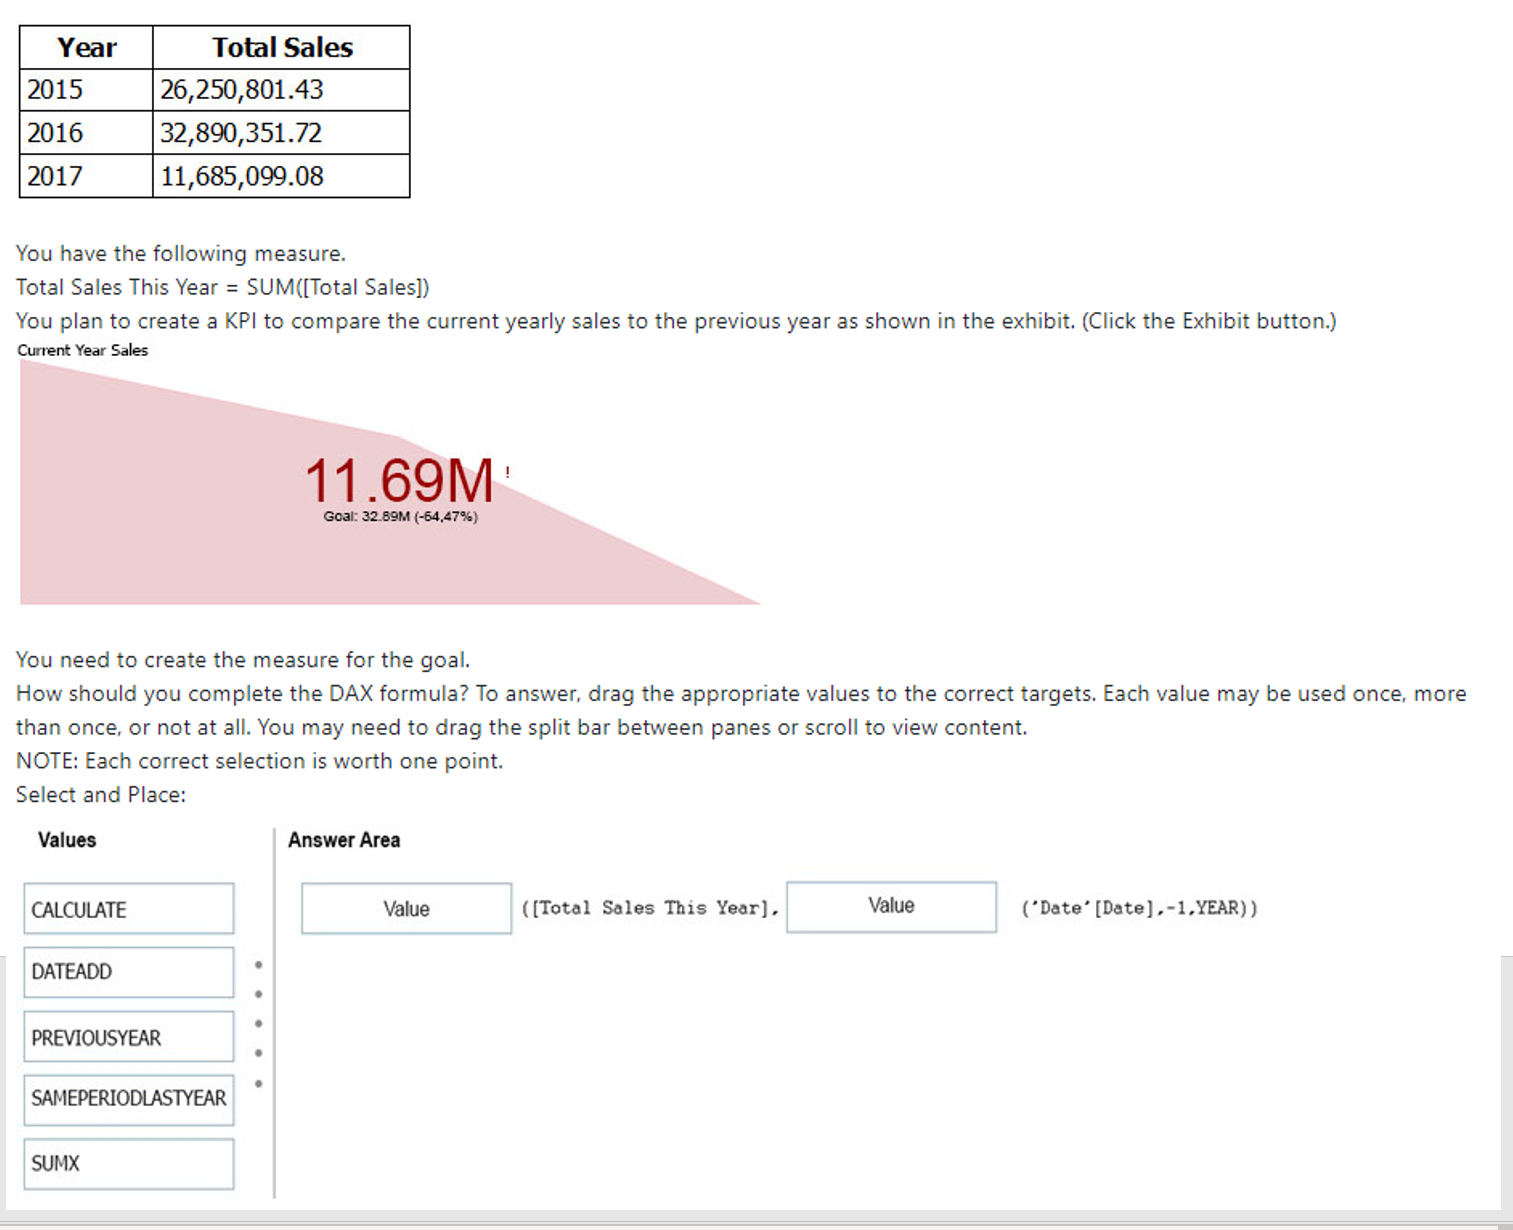
DRAG DROP -
You have a table named Sales. Sales contains the data shown in the following table.
Image:
Image (binary/octet-stream)
Answer
-
CALCULATE
-
PREVIOUSYEAR
-
DATEADD
-
SAMEPERIODLASTYEAR
-
SUMX
0 comments
Want to create your own Quizzes for free with GoConqr? Learn more.