
Quiz
Let's Try This!
This quiz has question types that open in the usual player.
Questions in this quiz (10)
1What type of graph is this?

- ABar Graph
- BLine Graph
- CHistogram
- DPie Chart
2What type of graph is this?

- ABar Graph
- BLine Graph
- CHistogram
- DPie Chart
3What type of graph is this?

- ABar Graph
- BLine Graph
- CHistogram
- DPie Chart
4What type of graph is this?
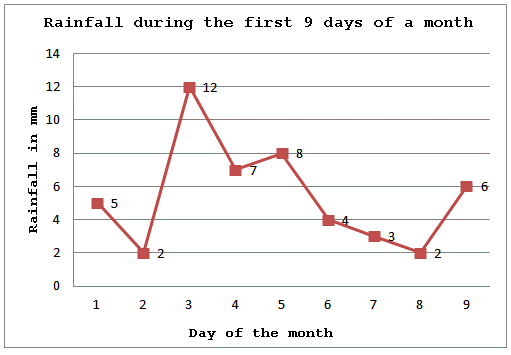
- ABar Graph
- BLine Graph
- CHistogram
- DPie Chart
5What is this graph missing?

- AAxes
- BCategories
- CTitle
- DPercentages
6A pie chart allows us to see...
- Ainformation about the proportion of parts relative to the whole.
- Bhow much data occurs within a range of numbers.
- Cthe total number of each category.
- Dthe spread of the data.
7A _______ displays data which are collected over a period of time to show the data change at regular intervals.
- ALine Graph
- BBar Graph
- CTable
- DHistogram
8Which of the following best describes a bar graph?
- AThis uses parallel bars, either horizontal or vertical, to represent counts for several categories
- BA line graph comprises dot-connected and grid-plotted lines.
- CThis graph shows how a part of something relates to the whole.
- DA bar graph consists of tabular frequencies, shown as adjacent rectangles, erected over intervals.
9Tables are a way of displaying and reporting data, making it easier to report patterns and relationships, shapes of distributions, and trends.
- ATrue
- BFalse
10The independent variables go in the [blank_start]left-hand[blank_end] columns, while the dependent variables are on the [blank_start]right-hand[blank_end] columns.
- Aright-hand
- Bleft-hand
Information
- Description
- Formative Assessment about Ways to Represent Data
- Author
- Rosanna Joy Lanado
- Language
- English
- Views
- 35
- Tags
- Rating
- No ratings yet Rate this quiz