
Quiz
PSYC302
Create a free account to finish this quiz
Save your progress and see your final score.
Already have an account? Sign in
Questions in this quiz (87)
1You have a categorical variable with 4 levels. You are interested in whether this categorical variable significantly predicts a continuous DV after controlling for the effects of another categorical variable with two levels. You also know the two categorical variables interact in predicting the DV. You would use:
- AAn ANCOVA
- BA hierarchical regression
- CFactorial ANOVA
- DNone of the above
2Lower bound confidence interval =
- AMean – (1.96 x SE)
- BMean + (1.96 x SE)
- CMean – (1.95 x SE)
- DMean + (1.95 x SE)
3Upper bound confidence interval =
- AMean - (1.95 x SE)
- BMean - (1.96 x SE)
- CMean + (1.95 x SE)
- DMean + (1.96 x SE)
4You are interested in whether two continuous variables are associated with each other, you use
- ASpearman correlation
- BANOVA
- CPearson correlation
- DBartlet's
5You are interested in whether two ordinal variables are associated, you use
- AANOVA
- BSpearman correlation
- CPearson Corellation
- DBartlet's
6You are interested in whether an ordinal variable is associated with a continuous variable
- ASpearman correlation
- BPearson Correlation
- CANOVA
- DBartlet's
7You have two variables. One is a continuous measure of IQ, the other a grouping variable, whether you are a liberal or labor voter. To analyse these data you could use?
- AAn independent groups t-test
- BA dependent groups t-test
- CA Pearson’s correlation
- DNone of the above
8If you are interested in the association between an IV and a DV:
• before the effects of the other IVs have been removed, you would interpret the ________
• after the effects of the other IVs have been removed, you would interpret the ________.- Abeta weights; beta weights
- Bzero-order correlations; zero-order correlations
- Cbeta weights; zero-order correlations
- Dzero-order correlations; beta weights
9For the above illustration, the value of the indirect path was estimated using bootstrapping and the confidence interval spanned zero. Further, the Sobel test was significant. You would conclude:
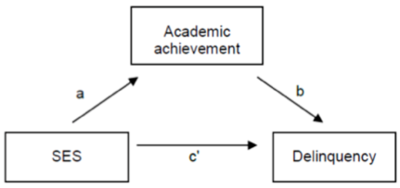
- AThe value of (a × b) was significant
- BThe value of (a × b) was not significant
- CThe value of (a + b) was significant
- DThe value of (a + b) was not significant
10Pretend you only know how to run an independent groups t-test. You want to know whether blonds, brunettes, redheads and greyheads differ on IQ, so you run multiple independent t-tests to assess this. If you then use a Bonferroni correction, you would divide your alpha level by:
- A3
- B6
- C10
- D.05
11You are interested in seeing wither a categorical variable with 4 levels predicts a continuous DV. The only stats method you know is multiple regression. What specific method would you use?
- AANOVA by multiple regression
- BMANOVA
- CANOVA
- Dt-test
12If, in an ANCOVA, the interaction between the IV and the covariate is significant:
- AYou should then plot the interaction so you are able to interpret this significant result
- BYou should run a simple slopes analysis to discern which slopes are significantly different from zero
- CYou have violated the assumption of independence between the IV and the covariate
- DYou have violated the assumption of homogeneity of regression slopes
13You have a categorical variable with 4 levels. You are interested in whether this categorical variable significantly predicts a continuous DV after controlling for the effects of another categorical variable with two levels. You also know the two categorical variables interact in predicting the DV. You would use:
- AAn ANCOVA
- BA hierarchical regression
- CFactorial ANOVA
- DNone of the above
14if a test showed (a) men do have more hair at age 20 than age 50, and (b) the p-value from SPSS was .08 you would conclude:
- AThe effect was in the reverse direction to that hypothesised
- BThere was no significant difference
- CThere was a significant difference at an alpha level of .05
- DThere was a significant difference at an alpha level of .01
15If the assumption of sphericity in repeated measures ANOVA is violated
- AThe F-value from the significance test will be too small
- BThe F-value from the significance test will be too large
- CThe F-value for Box’s M will be non-significant
- DThe F-value for the Durbin-Watson test will be significant
16Which of the following is NOT used to determine the number of factors to retain in factor analysis?
Select one:- ABartlett's test of sphericity
- BHybrid approach
- CScree plot
- DKaiser's rule
17A variable has no skewness. If the mean of this distribution is 12, the median will be:
Select one:- Agreater than 12
- BLess than 12
- C12
- DIt is not possible to work this out from the information given
18MANOVA makes use of
Select one:- ACategorical IV(s) and categorical DV(s)
- BContinuous IV(s) and continuous DV(s)
- CCategorical DV(s) and continuous IV(s)
- DContinuous DV(s) and categorical IV(s)
19The relationship between smoking and cancer is stronger for males than females. In this example, gender is best conceptualised as:
Select one:- AMediator
- BModerator
- CIV
- DDV
20If two predictor variables in a regression analysis are correlated above .95, you are likely to have a problem with
Select one:- Amulticollinearity
- Bsphericity
- Cheteroscedasticity
- Dnormality
21For the output, which of the following would compute the z score for skewness?
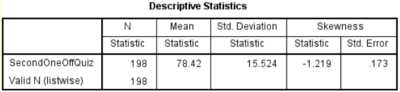
- A(-1.219-78.42)/.173
- B(-1.219-78.42)/(198-1)
- C-1.219/.173
- D-1.2192/.173
22The residuals in multiple regression represent:
Select one:- AThe differences between the constant and each original score.
- BThe squared differences between the constant and each original score
- CThe differences between the actual scores and the scores predicted by the model
- DThe squared differences between the actual scores and the scores predicted by the model
23Your p value is .004. You would report this as being
Select one:- Anot significant
- Bsignificant at .05
- Csignificant at .01
- Dsignificant at .001
24Your p value from SPSS is .016. You interpret your results using a directional hypothesis. Your finding is:
Select one:- Anot significant
- Bsignificant at an alpha level of .05
- Csignificant at an alpha level of .01
- Dsignificant at an alpha level of .001
25Using a repeated measures design gives you more power because it allows you to:
Select one:- ARemove variance due to individual differences from the numerator and the denominator when computing the F statistic
- BRemove variance due to individual differences from the numerator and the denominator when computing the z statistic
- CAdd variance due to individual differences to the numerator and the denominator when computing the F statistic
- DAdd variance due to individual differences to the numerator and the denominator when computing the z statistic
26Nine percent of the variance in number of hair follicles is explained by age. What was the correlation?
Select one:- A.81 or -.81
- B.81
- C.30 or -.30
- D.30
27A Type I error is when:
Select one:- AThe parameter is not significant in both the population and the sample drawn from the population
- BThe parameter is significant in the population but is not significant in the sample drawn from the population
- CThe parameter is significant in both the population and the sample drawn from the population
- DThe parameter is not significant in the population but is in the sample drawn from the population
28The variance is:
Select one:- AThe square root of the standard deviation
- BThe square of the standard deviation
- CThe square of the standard error
- DMeaningless
29When running a mediation analysis, you:
Select one:- ACenter the main effects
- BCenter the main effects and the DV
- CCenter the main effects, the DV and the interaction term
- DYou don't center any variables
30It is possible to have outliers among variables in which method?
Select one:- ARegression
- BFactor Analysis
- CThe ANOVA designs
- DIn Repeated Measures designs
31In discriminant function analysis, the group centroids represent
Select one:- Athe group means on the categorical DV.
- Bthe critical Mahalanobis distance for identifying multivariate outliers
- Cthe group means on the discriminant function(s)
- Dthe group means on each of the predictor variables
32A researcher is interested in predicting the "number of cigarettes smoked by adolescents" using three predictor variables: "gender", "number of cigarettes smoked by 3 closest friends", and "number of cigarettes smoked by parents". The most appropriate method to analyse these data would be:
Select one:- Amultiple linear regression
- Brepeated measures ANOVA
- Cfactor analysis
- Ddiscriminant function analysis
33Researchers prefer to use principal axis factoring when:
Select one:- AThe primary goal is to confirm an existing factor structure
- BThey wish to model the unique variance
- CThey wish to only study the common variance
- DThere are lots of variables and the communalities are all quite high
34Your confidence intervals are significant at 99% but are not significant at 95%. This means:
Select one:- AYou result is significant at an alpha level of .001
- BYou result is significant at an alpha level of .01
- CYou result is significant at an alpha level of .05
- DYou have made an error in your calculations
35You have done 10 tests of significance. To correct for this multiple testing you use a Bonferroni correction. After applying this correction, you would report a result as being significant if it had a p value less than:
Select one:- A.05
- B.01
- C.005
- D.001
36Which of the following is the correct sequence for computing the variance?
- ASum up the deviations; (2) divide by N-1; (3) take the square root
- BSquare the deviations; (2) Sum up the squared deviations; (3) divide by N-1
- CSquare the deviations; (2) divide by N-1; (3) take the square root
- DSquare the deviations; (2) divide by N-1
37Why would a researcher use a 0.01 alpha (significance) level instead of a 0.05?
Select one:- ATo reduce the chance of Type II errors
- BTo reduce the chance of Type I errors.
- CTo increase the chance of Type II errors.
- DTo increase the chance of Type I errors.
38The critical alpha level for a hypothesis test (usually p < .05) is:
- AThe probability that the homogeniety of covariance assumption is not met.
- BThe probability that the homogeniety of covariance assumption is met
- CThe probability that the test will produce a Type II error
- DThe probability that the test will produce a Type I error
39If a researcher deletes all cases that have missing data on one or more variables she intends to use in her analyses, she is employing.
Select one:- AExpectation maximization.
- BGroup mean imputation
- CPairwise deletion
- DListwise deletion
40An outlier is:
Select one:- ANone of these
- BA case that is substantially different than other cases in the sample
- CA case that is similar to other cases in the sample.
- DA case that is similar to other cases in the population
41A Type I error occurs:
Select one:- AWhen a researcher rejects a null hypothesis that is actually correct
- BWhen a researcher rejects a research hypothesis that is actually correct
- CWhen a researcher accepts a null hypothesis that is actually incorrect
- DWhen a researcher accepts a null hypothesis that is actually correct
42A t-test showed an experimental effect was significant and in the expected direction. Unfortunately, the Levene's test was also significant, meaning the "homogeneity of variances" assumption was violated. Beyond this, however, no assumptions were violated, and there were no outliers. (Also pretend the output only gives you the "equal variances assumed" row and that you don't get the "equal variances not assumed" row). Accordingly,
- AYou can make inferences about the population and your findings are applicable to the sample used
- BYou can NOT make inferences about the population but your findings are applicable to the sample used
- CYou can make inferences about the population but your findings are NOT applicable to the sample used
- DYou can NOT make inferences about the population and your findings are NOT applicable to the sample used
43A scatterplot is a graphical representation that summarises the relationship between two (or sometimes more) variables. Assume that you are presented with a scatterplot for which: (1) PSYC302 mark is plotted on the Y axis, and (2) average number of hours per day spent on Facebook is plotted on the x-axis. If the the plotted values fall tightly round a diagonal line running from the top left to the bottom right, you should conclude that:
- AThere is a strong negative correlation between students' PSYC302 marks and time spent on Facebook, but the plot tells us nothing about whether the relationship is significant or not
- BThere is a strong positive correlation between students' PSYC302 marks and time spent on Facebook, but the plot tells us nothing about whether the relationship is significant or not.
- CThere is a significant positive correlation between students' PSYC302 marks and time spent on Facebook
- DThere is a significant negative correlation between students' PSYC302 marks and time spent on Facebook
44If an experimenter observes a correlation of -1.00 between variables "X" and "Y", which of the following statements is/are true? (For simplicity, assume this correlation observed in the sample accurately reflects the correlation in the population).
- AThere is a perfect positive relationship between variables "X" and "Y".
- BThere is a perfect negative relationship between variables "X" and "Y".
- CIf the researcher knows the value of "X" for a participant, he/she can predict the value of "Y" with perfect accuracy
- DThere is a perfect negative relationship between variables "X" and "Y" AND If the researcher knows the value of "X" for a participant, he/she can predict the value of "Y" with perfect accuracy
45What is partial correlation?
- AA bivariate correlation that controls for respondents' scores on a third variable
- BA standardized regression coefficient.
- CAn unstandardized regression coefficient
- DNone of the above
46What type of correlation is used to assess the relationship between two ordinal variables?
- AChi Square.
- BPearson's.
- CLevene's.
- DSpearman's rho
47The constant and regression weights in multiple regression are computed:
- AUsing the ordinary least squares criterion.
- BTo minimise the sum of the squared deviations between the observed values for the DV and those predicted by the regression equation.
- CTo minimise the sum of the unsquared deviations between the observed values for the DV and those predicted by the regression equation.
- DUsing the ordinary least squares criterion AND To minimise the sum of the squared deviations between the observed values for the DV and those predicted by the regression equation.
48Researchers can safely conclude that there are no order dependencies in their data if the Durbin-Watson statistic has a value close to:
- ATen
- BZero
- CTwo
- DFive
49A "factor" in Factor Analysis is:
- ASimilar to independent variable in factorial ANOVA.
- BA cluster of highly correlated variables measuring the same underlying dimension.
- CA set of uncorrelated variables grouped together.
- DNone of the above.
50Oblique rotations in EFA produce two types of factor loading matrices: Structure matrix and pattern matrix.
The values in the pattern matrix are:
Select one:- ASpearman correlations between factors and variables.
- BRegression coefficients between factors and variables.
- CZero-order correlations between factors and variables.
- DThe correlations between the retained factors
51In exploratory factor analysis, there are several commonly applied decision rules that researcher apply to determine the number of factors to interpret.
Which of the following is NOT one of these?
Select one:- AHybrid approach.
- BScree test.
- CBartlett's test of sphericity.
- DKaiser's rule.
52Prior to computing an exploratory factor analysis, researchers often conduct a number of preliminary analyses to determine whether or not their data sets are suitable for EFA.
One such analysis is the KMO measure of sampling adequacy. What does this analysis assess?
Select one:- AWhether the correlation matrix is (or is not) significantly different from the identity matrix
- BWhether the sample size is large enough
- CWhether there are enough factors
- DNone of the above
53Factor loadings describe the strength of the relationship between factors and variables in the original data set.
If you've conduced and EFA with an orthogonal rotation, you should interpret the loadings in the ____________, whereas if you've conducted an oblique rotation, you should interpret the loadings in the ____________.
Select one:- APattern matrix, rotated component matrix.
- BPattern matrix, pattern matrix.
- CIdentity matrix, anti matrix.
- DRotated component matrix, pattern matrix.
54Researchers who conduct exploratory factor analyses often rotate their solutions. Why?
Select one:- ARotation of the axes allows each case to be seen instead of the factors.
- BRotation of the axes allows the factor loadings of each variable to be more clearly differentiated by factor
- CRotation of the axes allows each variable to be seen instead of cases
- DTo allow the researcher to look more closely at the variables vs cases matrix
55In a PCA, you would identify an outlying variable by:
Select one:- ARunning a histogram
- Bscreening for communalities greater than 1
- CScreening for unusually small communalities from the initial solution
- DScreening for unusually small communalities from the extracted solution
56For the output of a PCA, what are the ranges of possible values in the structure and pattern matrices:
Select one:- AThe values in both the structure and pattern matrices can be less than -1 or greater than +1.
- BThe values in the structure matrix must be between -1 and +1. The values in the pattern matrix can be less than -1 or greater than +1.
- CThe values in the structure matrix can be less than -1 or greater than +1. The values in the pattern matrix must be between -1 and +1.
- DThe values in both the structure and pattern matrices must be between -1 and +1.
57There are two broad types of rotation in exploratory factor analysis: orthogonal and oblique. After oblique rotations, factors:
Select one:- ACan be correlated or uncorrelated depending on the nature of the data set.
- BWill be uncorrelated.
- CWill be correlated.
- DNone of the above.
58You have 15 items, and you run a common factor analysis (NB: not a principle components analysis). If the first three factors explain 2/3rds of the variance, the sum of their eigenvalues would be:
Select one:- A10
- BLess than 10
- CGreater than 10
- D66%
59Which of the following is NOT a strategy for increasing power in ANOVA?
Select one:- AUsing highly correlated independent variables.
- BUsing highly reliable measures.
- CComparing extreme groups.
- DIncorporating covariates in the design
60When running a covariance analysis, one should interpret:
Select one:- AThe unadjusted group means.
- BThe adjusted group means.
- CThe covariate means.
- DThe unadjusted group means AND the covariate means.
61ANCOVA has several advantages relative to ANOVA. These include:
Select one:- AIt can control for potential confounds in correlational research designs
- BIt increases power in experimental research designs.
- CIt can control for correlated DVs in experimental studies.
- DIt can control for potential confounds in correlational research designs AND it increases power in experimental research designs.
62One of the key assumptions that must be met for ANCOVA is "homogeneity of regression slopes". This means that:
Select one:- AThe relationship between the covariate and the DV must NOT be similar across IV groups.
- BThe relationship between the multiple DVs must be very similar across all IV groups.
- CThe relationship between the covariate and the DV must be very similar across all IV groups.
- DThe relationship between the IV and DV must be very similar for all possible values of the covariate
63The Bonferroni correction is:
Select one:- AA type of post hoc test.
- BSimilar to a post hoc test, but is less conservative.
- CA correction for violations of the homogeneity of variance assumption.
- DA correction for violations of the homogeneity of regression slopes assumption
64In factorial ANOVA, the independent variables are:
Select one:- ACategorical, each with 2 or more levels.
- BContinuous, each with 2 or more levels.
- CContinuous, each with interval or ratio scales.
- DContinuous, each with 2 or more levels AND continuous, each with interval or ratio scales.
65Whenever an analysis is run with more than one IV, interaction effects may emerge. An interaction is present when:
Select one:- AThe relationship between the experimenter and the DV changes as a function of another IV.
- BThe relationship between the IV and DV changes as a function of a covariate
- CThe relationship between two IVs change as a function of a DV
- DThe relationship between the IV and DV changes as a function of another IV
66A study found jurors gave significantly longer sentences for fraud than robbery for both male and female perpetrators. This implies that there was ___________.
Select one:- AA main effect for type of juror.
- BA crime type by sex interaction.
- CA main effect of type of crime.
- DA main effect of sex
67In repeated measures ANOVA, the sphericity assumption:
Select one:- AAssumes the variance of the difference scores is equal across all pairs of levels of repeated measures factor
- BIs formally tested using Mauchly's Test
- CIs formally tested by Box's M statistic
- DAssumes the variance of the difference scores is equal across all pairs of levels of repeated measures factor AND is formally tested using Mauchly's Test
68You are interested in assessing the association between mental alertness, a continuous variable, and type of pain-killer, a between-subjects categorical variable with 4 levels. If the only method you knew was an independent-groups t-test, how many tests of significance would you need to run?
Select one:- A1
- B3
- C10
- DNone
69A researcher manipulates the amount of sleep and coffee students get to assess the impact this has on a continuous measure of exam performance. Sleep has three levels:
No sleep the night before the exam,
4 hours sleep the night before the exam,
A full nights sleep the night before the exam.
And coffee has three levels:
No coffee before the exam,
A weak coffee before the exam,
A strong coffee before the exam.
Assuming a completely independent (between) groups design and 20 participants per group, how many participants will there be in the study?- A120
- B180
- C20
- D60
70Simple effects analysis is commonly employed in ANOVA to determine whether:
Select one:- AThere is a main effect of one IV at individual levels of a second IV.
- BThere is a main effect for ANOVAs involving a single IV.
- CThere is a main effect of one independent variable at individual levels of the DV
- DThere is a significant interaction between two IVs
71A researcher is conducting a repeated measures analysis, and violates the sphericity assumption. Which of the following represent an appropriate strategy for dealing with this problem?
Select one:- AStand on the offending variable to reduce its variance to an acceptable level.
- BInterpret the Durbin-Watson.
- CInterpret the Epsilon adjusted F-test.
- DNone of the above
72If, in an ANCOVA, the interaction between the IV and the covariate is significant,
Select one:- AYou should then plot the interaction so you are able to interpret this significant result.
- BYou should run a simple slopes analysis to discern which slopes are significantly different from zero
- CYou have violated the assumption of independence between the IV and the covariate
- DYou have violated the assumption of homogeneity of regression slopes
73MANOVA is "shorthand" for:
- AMultivariate Analysis of Variability
- BMultinomial Analysis of Variance
- CMultivariate Analysis of Variance
- DMultinomial Analysis of Variability
74MANOVA is used to determine:
Select one:- AWhether group differences on a linear combination of DVs and IVs are likely to have occurred by chance
- BWhether group differences on a linear combination of DVs are likely to have occurred by chance
- CWhether group differences on a linear combination of IVs are likely to have occurred by chance
- DWhether group differences on a non-linear combination of DVs are likely to have occurred by chance
75Information provided by DFA but not MANOVA is:
Select one:- AWhether the 2nd discriminant function on its own is significant.
- BWhether the 1st and 2nd discriminant functions (i.e. linear variates) combined are significant
- CWilks's Lambda
- DRoy's GCR
76Univariate ANOVA and discriminant analysis are ways of answering different questions arising from a significant MANOVA. If univariate ANOVAs are chosen, _______________ corrections may need to be applied to the level at which you accept significance.
Select one:- ARoy's.
- BWilks'.
- CBartlett
- DBonferroni
77Wilks' lamba is an example of a "pooled multivariate test". This means:
Select one:- AIt tests the significance of each dependent variable separately.
- BIt tests the significance of all linear variates simultaneously.
- CIt tests the significance of the first or second linear variate, depending on which one is larger.
- DIt tests the significance of the first linear variate only.
78In Discriminant Function Analysis, a combined groups plot:
Select one:- AProvides a visual representation of how the DV groups differ on the first two discriminant functions.
- BProvides a significance test to determine how the DV groups differ from each other on each discriminant function
- CProvides an index of how much variance is shared by the categorical DV and each discriminant function
- DShows how strongly each predictor variable correlates with the discriminant functions
79Roy's Greatest Characteristic Root:
- AAssesses the significance of all linear variates simultaneously
- BAssesses the significance of the first linear variate only.
- CIs a pooled test.
- DAssesses the significance of the first linear variate only AND is a pooled test.
80Including one or more covariates is a useful strategy for increasing statistical power in ANOVA. To be maximally effective, covariates should be:
Select one:- AUncorrelated with your IV(s) and moderately to strongly correlated with your DV.
- BUncorrelated with your DV and moderately to strongly correlated with your IV(s).
- CModerately to strongly correlated with your IV(s) and your DV.
- DNone of the above.
81In Discriminant Function Analysis, IVs and and DVs must conform to specific measurement scales.
The IVs must be ____________, and the DV must be __________.
Select one:- AOrdinal; a random variable.
- BInterval or ratio scaled variables; a categorical variable.
- CCategorical variable ; a categorical variable.
- DInterval or ratio scaled variables; an interval or ratio scaled variable.
82Imagine you're looking at a combined groups plot of two discriminant functions, and one datapoint is off on its own. How might you identify, statistically, if this is an outlier?
- ACompute Mahalanobis Distance using the two discriminant function
- BIdentify cases on each discriminant function with z-scores beyond plus +/- 3.29
- CCompute tolerance for the discriminant functions
- DRun a factor analysis
83Identity Matrix:
- Acorrelation table in which all variables are completely unrelated to eachother
- Btype of rotation that produces uncorrelated factors
- Cproportion of a variable's variance shared with retained factors
- Ddescribes the strength of the relationship between each variable and factors
84Varimax:
- Atype of rotation that produces uncorrelated factors
- Bcorrelation table in which all variables are completely unrelated to each other
- Cproportion of a variance's variance shared with retained factors
- Ddescribes the strength of the relationship between each variable and factors
85Eigenvalue:
- AA measure of the amount of variance each factor explains in a set of variables
- Btype of rotation that produces uncorrelated factors
- Cproportion of a variance's variance shared with retained factors
- Dcorrelation table in which all variables are completely unrelated to each other
86Factor Loading:
- Adescribes the strength of the relationship between each variable and factors
- Bproportion of a variable's variance shared with retained factors
- Ctype of rotation that produces uncorrelated factors
- Da measure of the amount of variance each factor explains in a set of variables
87Communality:
- Aproportion of a variance's variance shared with retained factors
- Btype of rotation that produces uncorrelated factors
- Ccorrelation table in which all variables are completely unrelated to each other
- Ddescribes the strength of the relationship between each variable and factors
Information
- Description
- Quiz on PSYC302, created by me_4452 on 03/10/2015.
- Author
- me_4452
- Language
- English
- Views
- 1
- Rating
- No ratings yet Rate this quiz