
Quiz
2
Create a free account to finish this quiz
Save your progress and see your final score.
Already have an account? Sign in
Questions in this quiz (22)
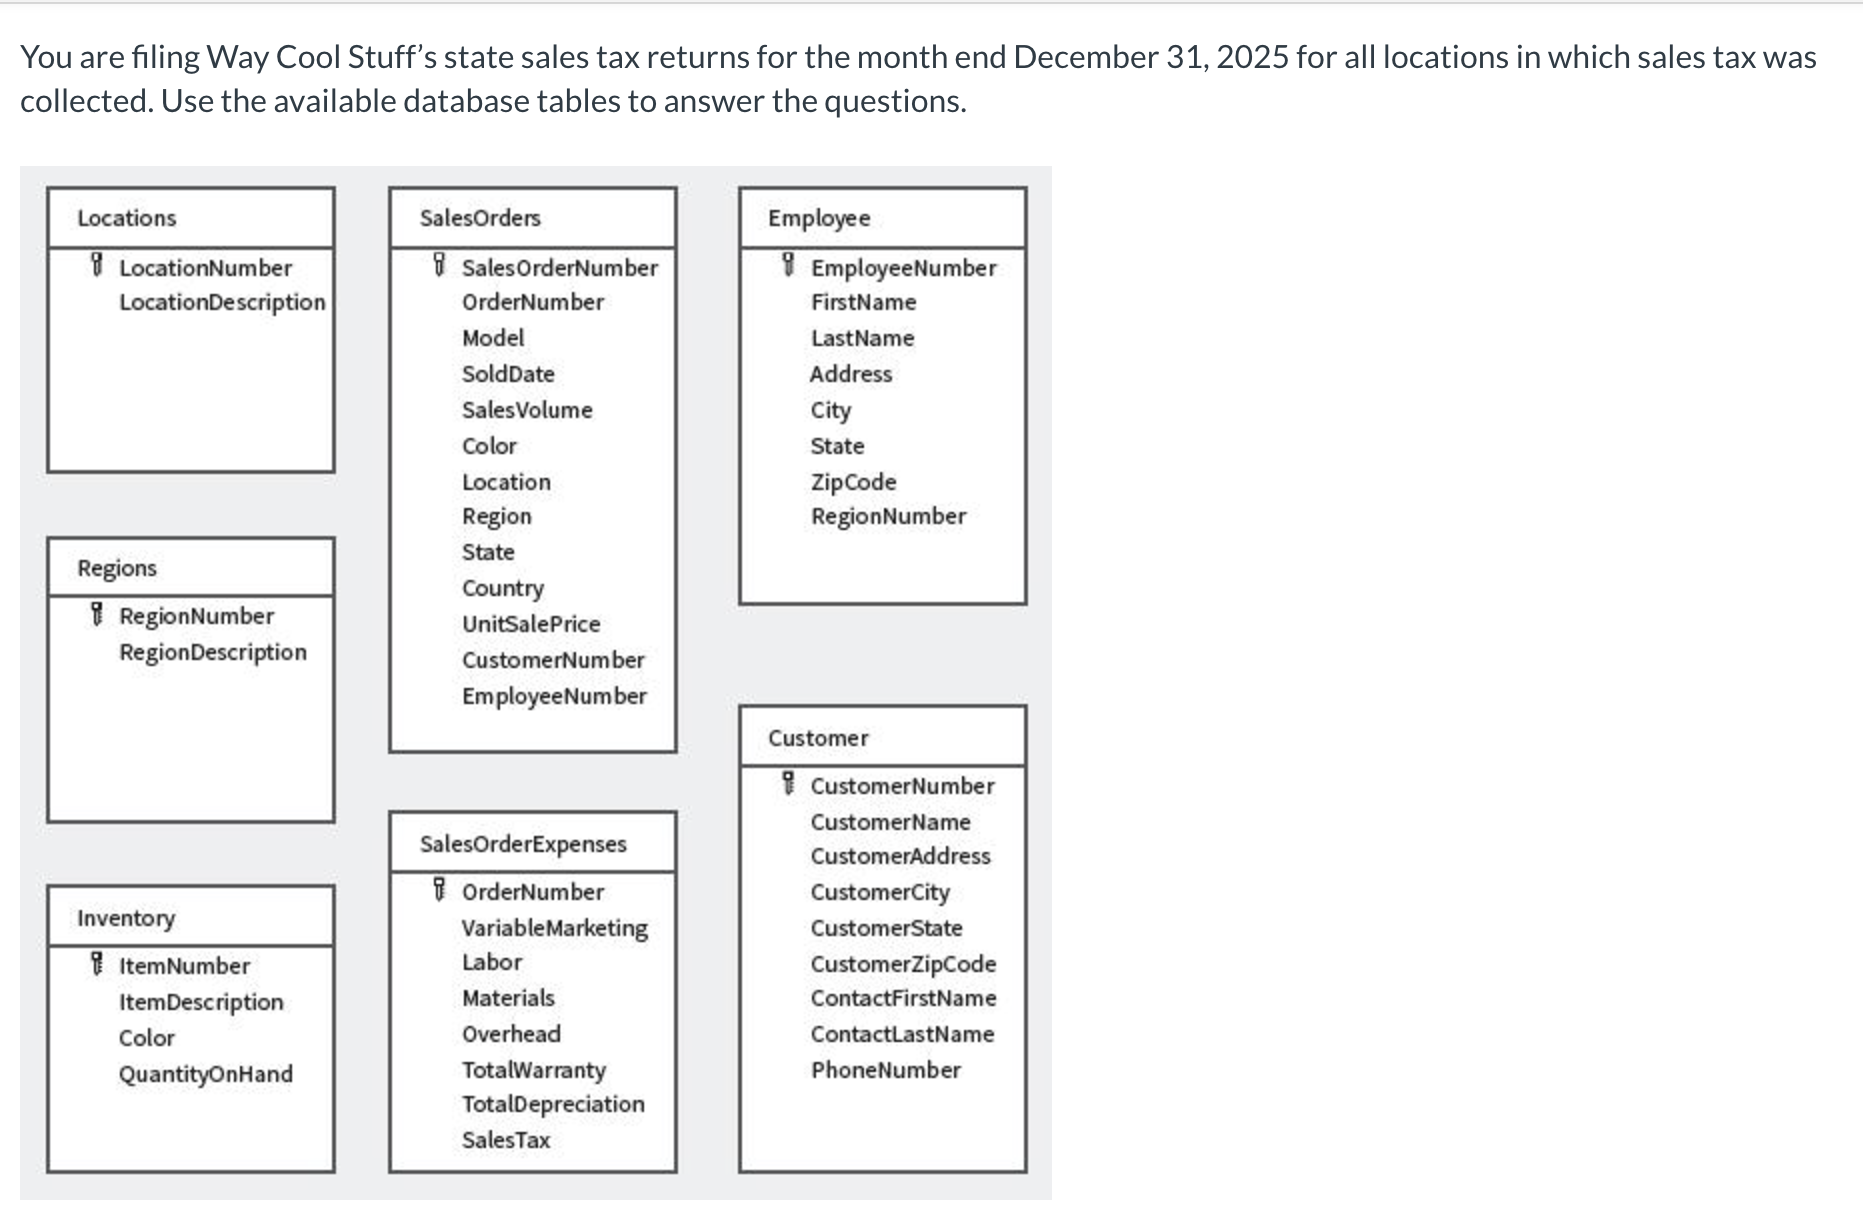
1Which tables do you need to be able to gather data needed to calculate sales tax remittance for December 2025?
- AOrder Number
- BSalesOrders, SalesOrderExpenses
2What fields will you use to join the tables?
- AOrderSales
- BOrderNumber
3Which fields will you need to gather the information necessary to submit sales tax 2025
- ASales Tax from the SalesOrder Expenses table and OrderNumber, SoldDate, State from SalesOrders table, OrderNumber
- BOrderNumber, Sales Tax from the SalesOrder Expenses table and OrderNumber, SoldDate, State from SalesOrders table.
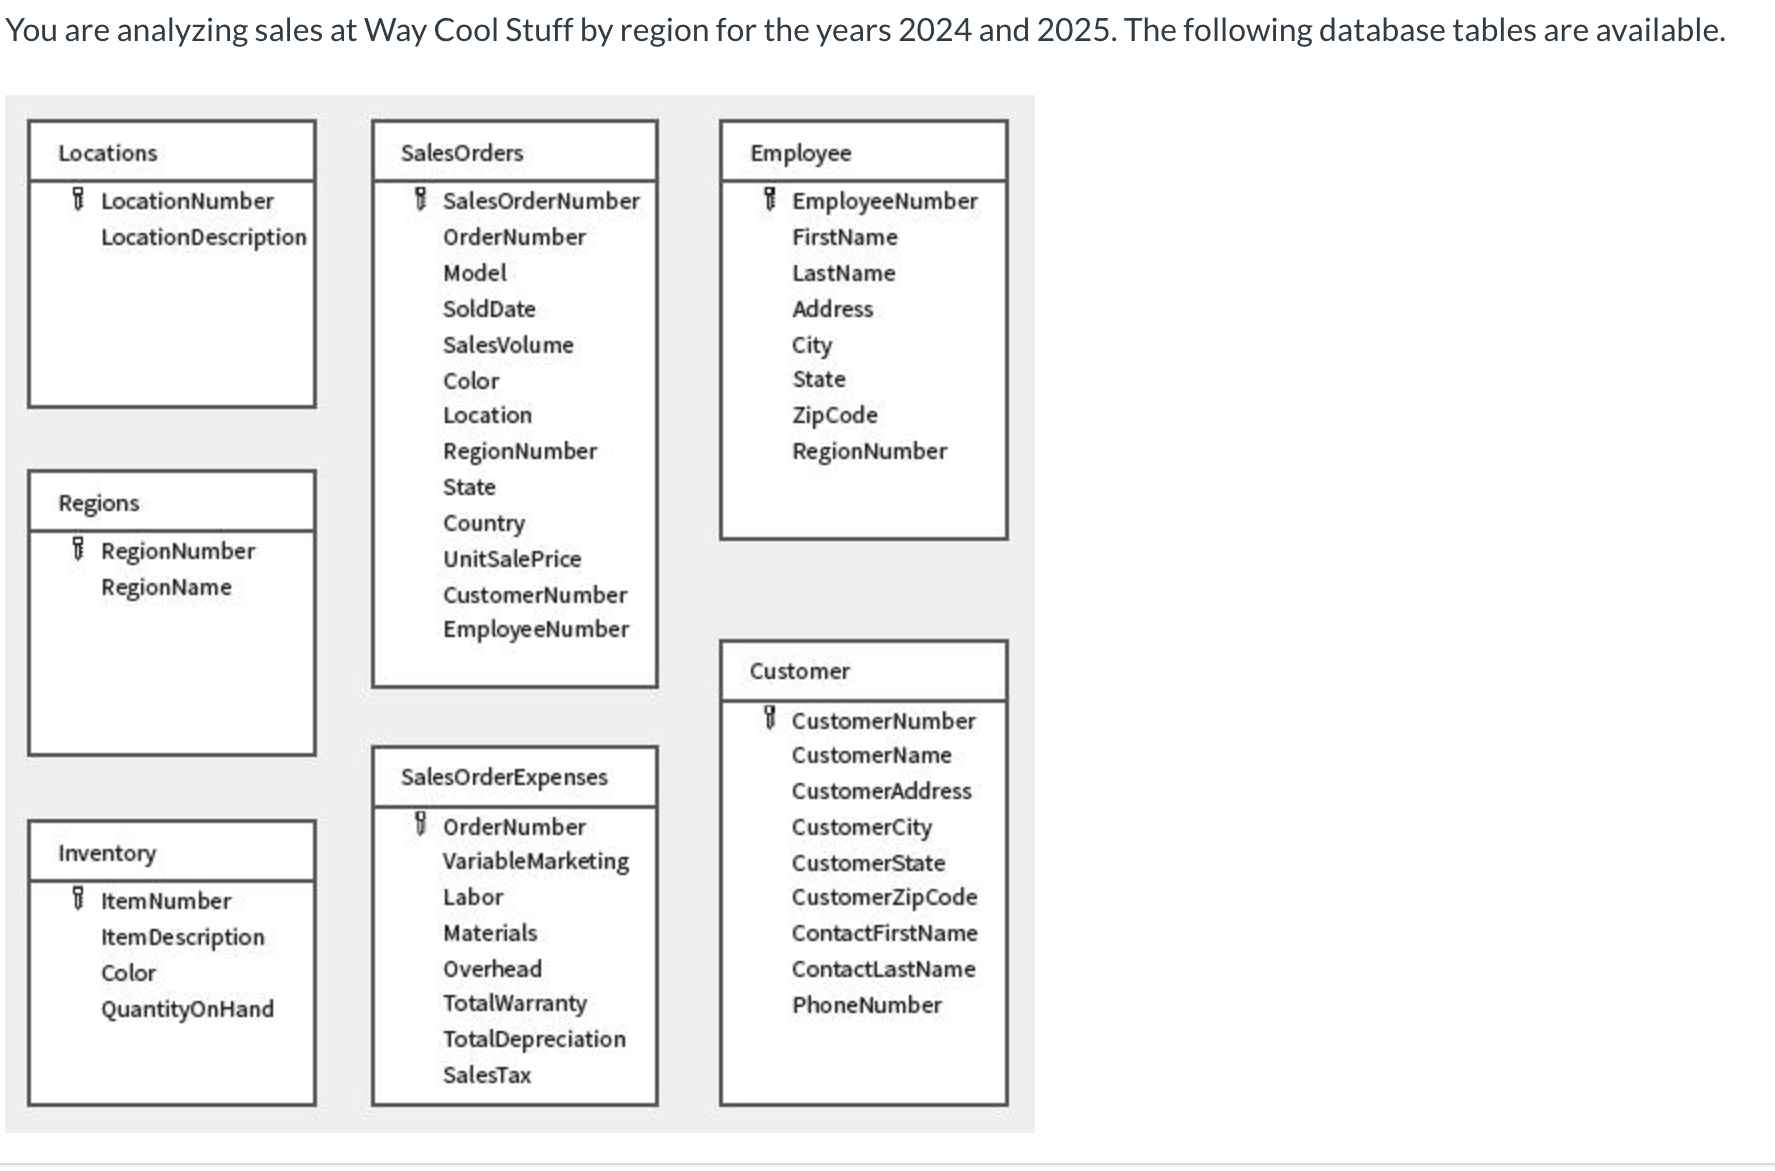
4Which tables do you need to gather the data necessary to analyze gross sales by region for 2024 and 2025?
- ARegions and Sales Order
- BSales Number and Order
5Which fields will you need to perform your analysis?
- AAll fields from the Regions table and SalesOrderNumber, SoldDate, RegionNumber, Sales Volume, UnitSalePrice from SalesOrders table.
- BSalesOrderNumber, SoldDate, RegionNumber, Sales Volume, UnitSalePrice from SalesOrders table.
6Assume you are a financial analyst in the controller's group for your distribution company. You have been asked to identify all inventory items without sales in the past year:
- The IT group has provided the inventory on hand data file and the twelve month sales data file.
• You have identified the inventory on hand table as the left table and the twelve month sales table as the right table. what Join is most appropriate?- ALeft Join
- BRight Join
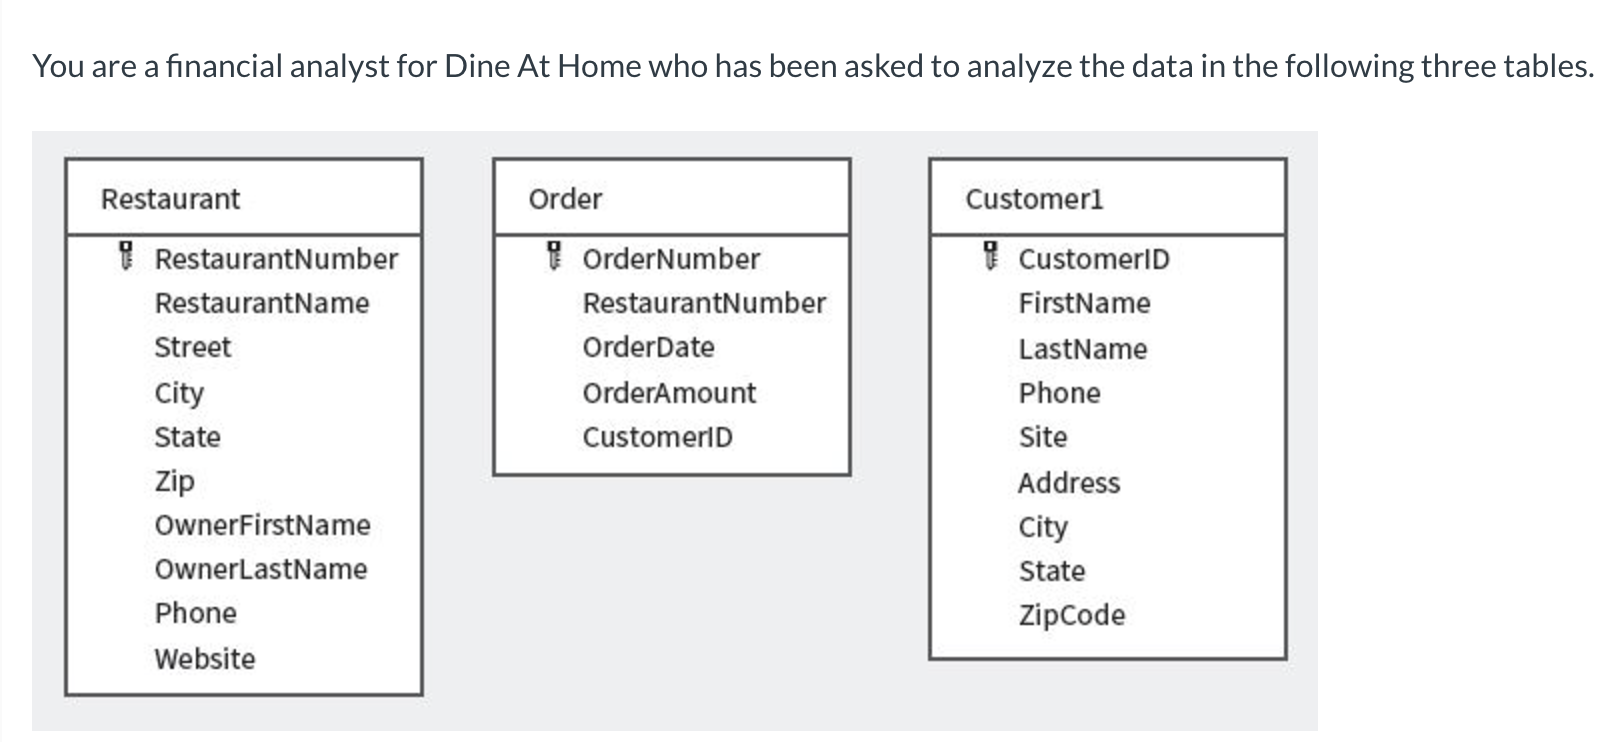
7Execute a query to join the Restaurant table (left table) and the Order table (right table), but only return the rows from both tables that have matching values.
- ALeft Join
- BInner Join
8Execute a query to join the Restaurant table (left table) and the Customer 1 (right table) table, and return all records from the Restaurant table, but only those matching records from the Customer 1table.
- ALeft Join
- BInner Join
9Execute a query to join the Order table (left table) and the Customer 1 table (right table), and return all
- ALeft Join
- BInner Join
- CFull join
10Execute a query to join the Order table (left table) and the Customer1 table (right table), and only return all the records from the Order table and the matching records from the Customer1 table
- ALeft join
- BFull Join
- CInner join
11Which of the following Microsoft Excel functions returns the arithmetic mean for a range or array of numbers?
- AAVERAGEIF
- BSUM
- CAVERAGE
- DMEAN
12Which of the following Microsoft Excel functions counts the number of cells specified by a given set of criteria?
- ACOUNTIFS
- BCOUNTA
- CCOUNT
- DCOUNTIF
13This function adds the cells specified by a given set of conditions or criteria
- ASUM
- BSUMIFS
- CSUMPRODUCT
- DSUMIF
14The function adds the cells specified by a condition or criteria
- ASUMIFS
- BSUM
- CSUMPRODUCT
- DSUMIF
15Which tool in Microsoft Excel will reorganize spreadsheet data into custom summaries of key information?
- AFilter
- BDeveloper
- CPivotTable
- DSort
16A Pivot Table displays sales by product type, year of sale, and the total dollar amount of sale. You would like to only see three of the 15 specific product types. The best way to focus only on the specific product types you are interested in is to use
- Acut and paste
- Bthe SUMIG function
- Cthe SORT function
- Da filter
17Auto filter functionality in a PivotTable can be assessed by
- Aclicking on the dropdown arrow in the row labels
- Busing the filter box in the PivotTable Fields
- Cclicking on the dropdown arrow in the filter box
- Ddragging a field to the field filter box
18If the coefficient of skewness is -1.5, the data distribution will have a
- Ahigh degree of skewness and tail to the left
- Bmoderate degree of skewness and tail to the left
- Chigh degree of skewness and tail to the right
- Dmoderate degree of skewness and tail to the right
19Measure of dispersion show
- Alocation
- Bcentral tendency
- Cvariation
- Dshape
20Which of the following are benefits of data visualization?
- AVisualizing helps to quickly understand large data sets
- BData visualization can be used to explore data.
- CData visualization can be used to explain data analysis.
- DAll of these are benefits of data visualization.
21A visualization used to represent changes in volume over time is a/an
- Aline graph
- Bpie chart
- Cbar chart
- Darea chart
22A visualization used to illustrate simple part-to-whole relationships is a/an
- Apie chart
- Bline graph
- Cbar chart
- Darea chart
Information
- Description
- University acc Quiz on 2, created by Jake Jakes on 15/12/2024.
- Author
- Jake Jakes
- Language
- English
- Views
- 1
- Tags
- Rating
- No ratings yet Rate this quiz