
Quiz
p51-100
Create a free account to finish this quiz
Save your progress and see your final score.
Already have an account? Sign in
Questions in this quiz (50)
151. In Power Query Editor, you have three queries named ProductCategory, ProductSubCategory, and Product.
Every Product has a ProductSubCategory.
Not every ProductsubCategory has a parent ProductCategory.
You need to merge the three queries into a single query. The solution must ensure the best performance in Power Query.
How should you merge the tables? To answer, drag the appropriate merge types to the correct queries. Each merge type may be used once, more than once, or not at all. You may need to drag the split bar between panes or scroll to view content.
NOTE: Each correct selection is worth one point.
Select and Place: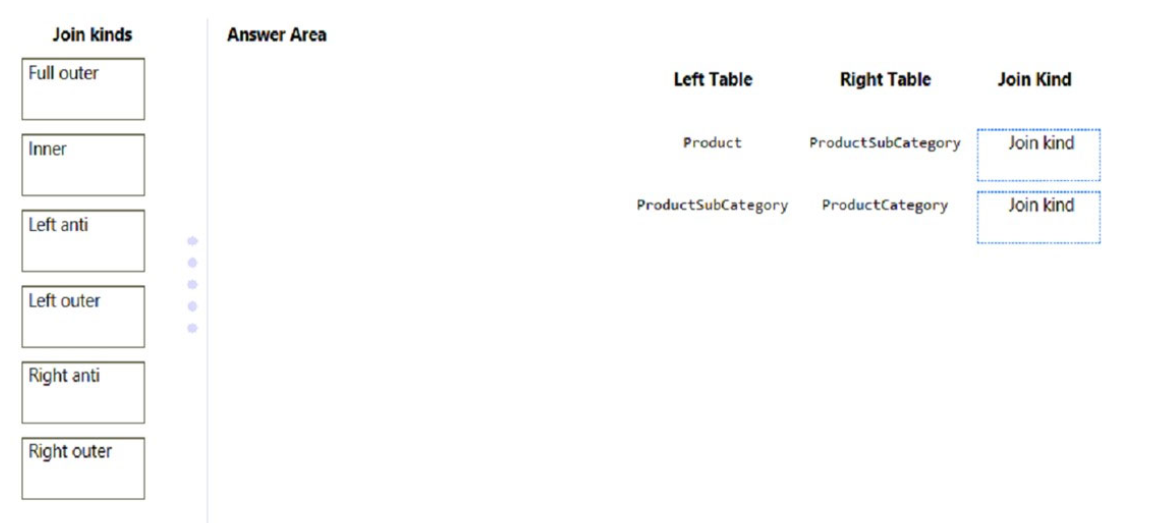
- A1. Inner
2. Left Anti - B1. Inner
2. Left Outer - C1. Right Outer
2. Left Outer
- A1. Inner
252. You are building a Power BI report that uses data from an Azure SQL database named erp1.
You import the following tables.
You need to perform the following analyses:
✑ Orders sold over time that include a measure of the total order value
Orders by attributes of products sold
Question
The solution must minimize update times when interacting with visuals in the report.
What should you do first?
- AFrom Power Query, merge the Order Line Items query and the Products query.
- BCreate a calculated column that adds a list of product categories to the Orders table by using a DAX function.
- CCalculate the count of orders per product by using a DAX function.
- DFrom Power Query, merge the Orders query and the Order Line Items query.
353. You have a Microsoft SharePoint Online site that contains several document libraries.
One of the document libraries contains manufacturing reports saved as Microsoft Excel files. All the manufacturing reports have the same data structure.
You need to use Power BI Desktop to load only the manufacturing reports to a table for analysis.
What should you do?- AGet data from a SharePoint folder and enter the site URL Select Transform, then filter by the folder path to the manufacturing reports library.
- BGet data from a SharePoint list and enter the site URL. Select Combine & Transform, then filter by the folder path to the manufacturing reports library.
- CGet data from a SharePoint folder, enter the site URL, and then select Combine & Load.
- DGet data from a SharePoint list, enter the site URL, and then select Combine & Load.
454. You have a Microsoft Excel workbook that contains two sheets named Sheet1 and Sheet2.
Sheet1 contains the following table named Table1.
Sheet2 contains the following table named Table2.
You need to use Power Query Editor to combine the products from Table1 and Table2 into the following table that has one column containing no duplicate values.
Which three actions should you perform in sequence? To answer, move the appropriate actions from the list of actions to the answer area and arrange them in the correct order.
Select and Place: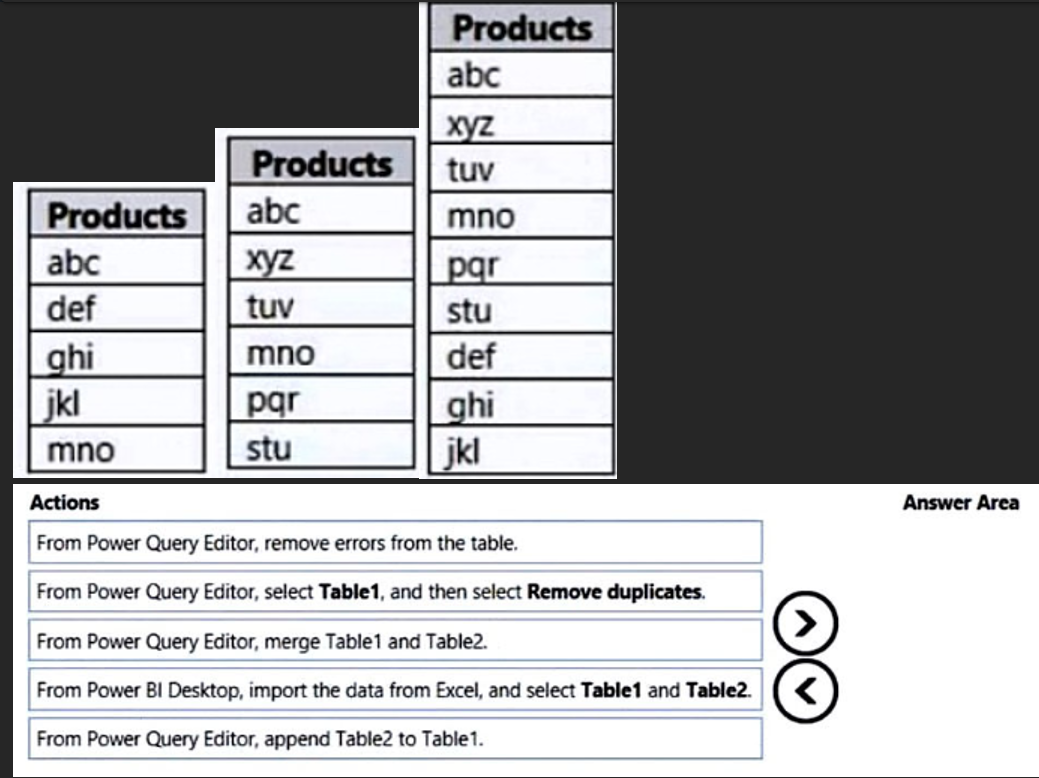
- AFrom Power BI Desktop, import the data from Excel, and select Table1 and Table2.
From Power Query Editor, append Table2 to Table1.
From Power Query Editor, select Table1, and then select Remove duplicates. - BFrom Power Query Editor, merge Table1 and Table2.
From Power BI Desktop, import the data from Excel, and select Table1 and Table2.
From Power Query Editor, append Table2 to Table1. - CFrom Power Query Editor, remove errors from the table.
From Power Query Editor, append Table2 to Table1.
From Power Query Editor, select Table1, and then select Remove duplicates.
- AFrom Power BI Desktop, import the data from Excel, and select Table1 and Table2.
555. You need to update the Power BI model to ensure that the analysts can quickly build drill-downs from business unit to product in a visual.
What should you create?- Aa group
- Ba calculated table
- Ca hierarchy
- Da calculated column
656. You need to create the Top Customers report.
Which type of filter should you use, and at which level should you apply the filter? To answer, select the appropriate options in the answer area.
NOTE: Each correct selection is worth one point.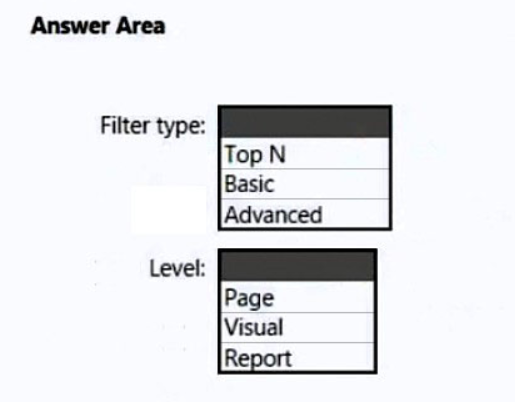
- Afilter type: top N
level: Page - Bfilter type: top N
level: Visual - Cfilter type: Basic
level: Report
- Afilter type: top N
757. You need to create the On-Time Shipping report. The report must include a visualization that shows the percentage of late orders.
Which type of visualization should you create?- Apie chart
- Bscatterplot
- Cbar chart
858. You need to create a KPI visualization to meet the reporting requirements of the sales managers.
How should you create the visualization? To answer, select the appropriate options in the answer area.
NOTE: Each correct selection is worth one point.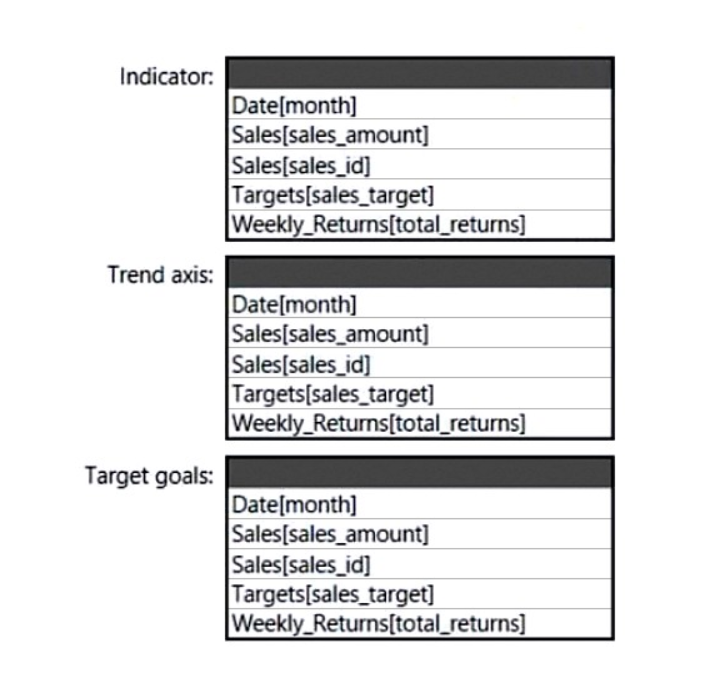
- AIndicator: Sales[sales_amount]
Trend axis: Date[month]
Target goals: Targets[sales_target] - BIndicator: Sales[sales_amount]
Trend axis: Weekly_Returns[total_returns]
Target goals: Sales[sales_id] - CIndicator: Sales[sales_id]
Trend axis: Date[month]
Target goals: Targets[sales_target]
- AIndicator: Sales[sales_amount]
959. You publish the dataset to powerbi.com.
For each of the following statements, select Yes if the statement is true. Otherwise, select No.
NOTE: Each correct selection is worth one point.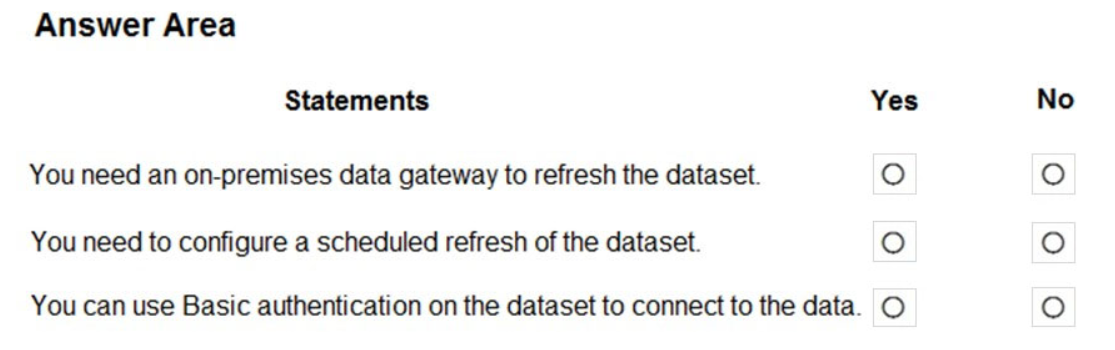
- Ayes yes yes
- Byes no yes
- Cno yes no
- Dno no no
1060. What should you create to meet the reporting requirements of the sales department?
- Aa measure column that uses the following formula: SUMX(FILTER('Sales', 'Sales'[sales_amount] > 0)),[sales_amount])
- Ba calculated column that uses the following formula: ABS(Sales[sales_amount])
- Ca calculated column that uses the following formula: IF(ISBLANK(Sales[sales_amount]),0, (Sales[sales_amount]))
- Da measure that uses the following formula: SUM(Sales[sales_amount])
1161. You need to grant access to the business unit analysts.
What should you configure? To answer, select the appropriate options in the answer area.
NOTE: Each correct selection is worth one point.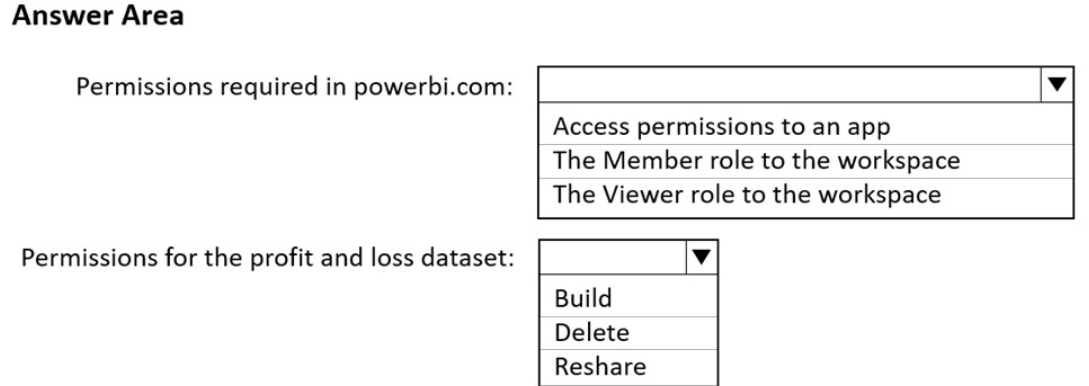
- APermissions required in powerbi.com: The Member role to the workspace The Viewer role to the workspace
Permissions for the profit and loss dataset: Reshare - BPermissions required in powerbi.com: Access permissions to an app
Permissions for the profit and loss dataset: Build - CPermissions required in powerbi.com: The Viewer role to the workspace
Permissions for the profit and loss dataset: Build
- APermissions required in powerbi.com: The Member role to the workspace The Viewer role to the workspace
1262. How should you distribute the reports to the board? To answer, select the appropriate options in the answer area.
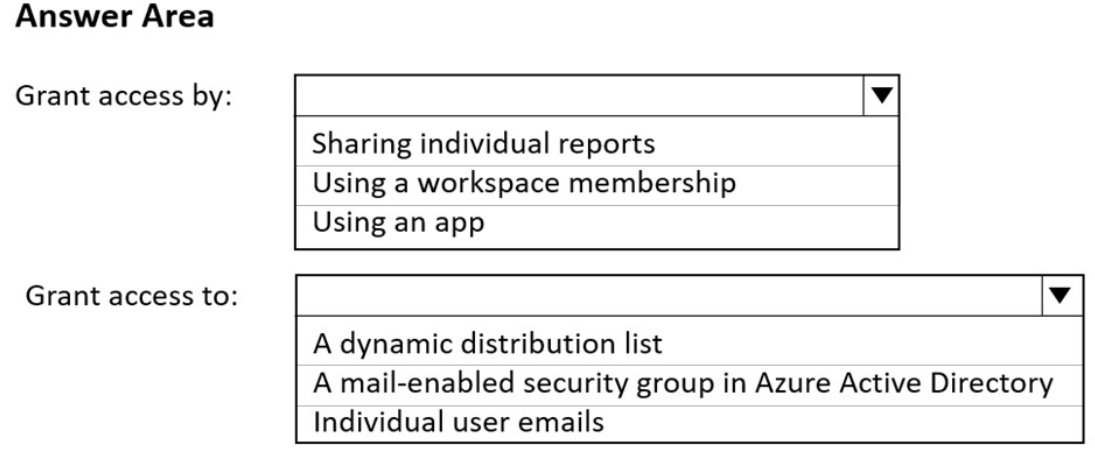
- AGrant access by: Using a workspace membership
Grant access to: A mail-enabled security group in Azure Active Directory - BGrant access by: Using an App
Grant access to: A mail-enabled security group in Azure Active Directory - CGrant access by: Using a workspace membership
Grant access to: Individual user emails
- AGrant access by: Using a workspace membership
1363. You need to ensure that the data is updated to meet the report requirements. The solution must minimize configuration effort.
What should you do?- AFrom each report in powerbi.com, select Refresh visuals.
- BFrom Power BI Desktop, download the PBIX file and refresh the data.
- CConfigure a scheduled refresh without using an on-premises data gateway.
- DConfigure a scheduled refresh by using an on-premises data gateway.
1464. What is the minimum number of Power BI datasets needed to support the reports?
- Aa single imported dataset
- Btwo imported datasets
- Ctwo DirectQuery datasets
- Da single DirectQuery dataset
1565. You are creating a report in Power BI Desktop.
You load a data extract that includes a free text field named coll.
You need to analyze the frequency distribution of the string lengths in col1. The solution must not affect the size of the model.
What should you do?- AIn the report, add a DAX calculated column that calculates the length of col1
- BIn the report, add a DAX function that calculates the average length of col1
- CFrom Power Query Editor, add a column that calculates the length of col1
- DFrom Power Query Editor, change the distribution for the Column profile to group by length for col1
1666. You have a Power BI model that contains a table named Sales and a related date table. Sales contains a measure named Total Sales.
You need to create a measure that calculates the total sales from the equivalent month of the previous year.
How should you complete the calculation? To answer, select the appropriate options in the answer area.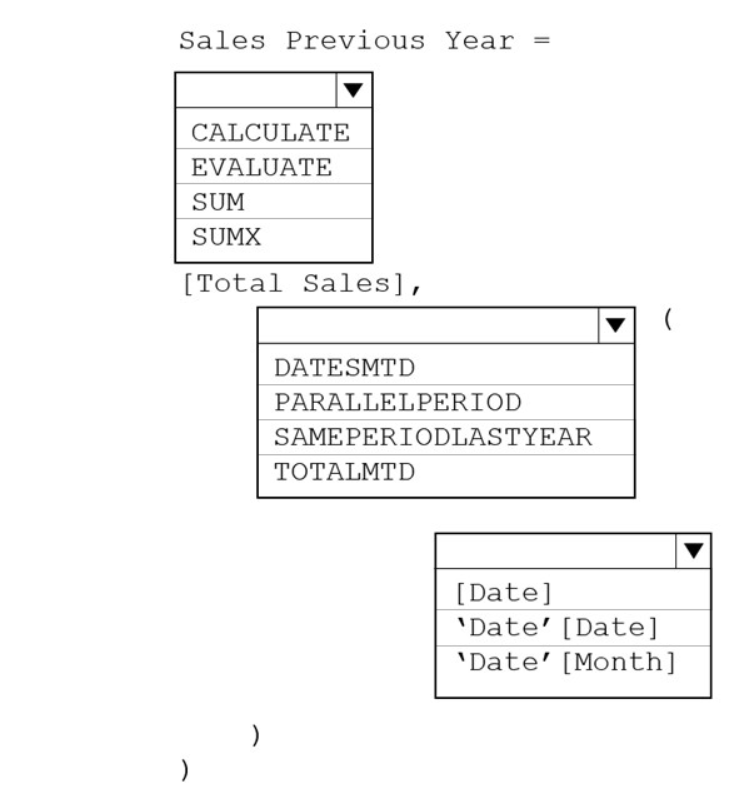
- A1. EVALUATE
2. DATESMTD
3. [Date] - B1. CALCULATE
2. PARALLELPERIOD
3. 'Date'[Date] - C1. CALCULATE
2. SAMEPERIODLASTYEAR
3. 'Date'[Date]
- A1. EVALUATE
1767. You have a Power BI semantic model that contains two queries.
You discover that a report based on the model has performance issues.
You plan to use Power Query to reduce the data loaded to the model.
Which two actions should you perform? Each correct answer presents part of the solution.
NOTE: Each correct answer is worth one point.- AApply group by and summarize techniques.
- BCombine the queries by using Append.
- CRemove unnecessary columns and rows.
- DCombine the queries by using Merge.
- ECreate a new query group.
1868. Note: This question is part of a series of questions that present the same scenario. Each question in the series contains a unique solution that might meet the stated goals. Some question sets might have more than one correct solution, while others might not have a correct solution.
After you answer a question in this section, you will NOT be able to return to it. As a result, these questions will not appear in the review screen.
You have an on-premises data gateway.
You need to reduce the amount of data sent through the gateway by semantic models that run in Import storage mode.
Solution: You create aggregations to summarize results.
Does this meet the goal?- Ayes
- Bno
1969. Note: This question is part of a series of questions that present the same scenario. Each question in the series contains a unique solution that might meet the stated goals. Some question sets might have more than one correct solution, while others might not have a correct solution.
After you answer a question in this section, you will NOT be able to return to it. As a result, these questions will not appear in the review screen.
You have an on-premises data gateway.
You need to reduce the amount of data sent through the gateway by semantic models that run in import storage mode.
Solution: You increase Automatic page refresh intervals.
Does this meet the goal?- Ayes
- Bno
2070. Note: This question is part of a series of questions that present the same scenario. Each question in the series contains a unique solution that might meet the stated goals. Some question sets might have more than one correct solution, while others might not have a correct solution.
After you answer a question in this section, you will NOT be able to return to it. As a result, these questions will not appear in the review screen.
You have an on-premises data gateway.
You need to reduce the amount of data sent through the gateway by semantic models that run in import storage mode.
Solution: You configure incremental refresh.
Does this meet the goal?- Ayes
- Bno
2171. Note: This question is part of a series of questions that present the same scenario. Each question in the series contains a unique solution that might meet the stated goals. Some question sets might have more than one correct solution, while others might not have a correct solution.
After you answer a question in this section, you will NOT be able to return to it. As a result, these questions will not appear in the review screen.
You have an on-premises data gateway.
You need to reduce the amount of data sent through the gateway by semantic models that run in Import storage mode.
Solution: You decrease the dashboard cache update frequency.
Does this meet the goal?- Ayes
- Bno
2272. You have a Power BI semantic model named Model1.
You need to create a measure that will display the sales result for all blue units. The solution must maintain the existing filter context.
How should you complete the DAX expression? To answer, select the appropriate options in the answer area.
NOTE: Each correct selection is worth one point.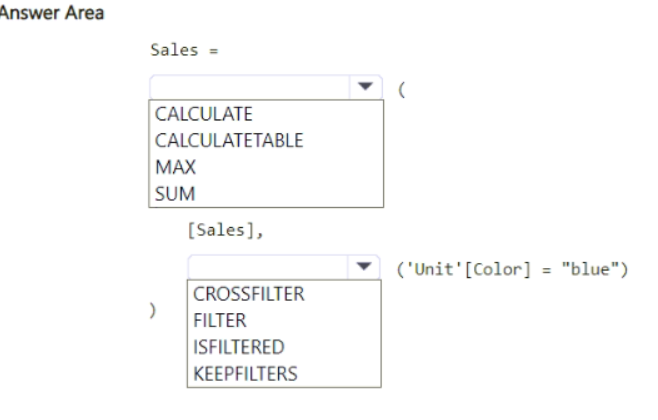
- A1. CALCULATE
2. KEEPFILTERS - B1. CALCULATETABLE
2. KEEPFILTERS - C1. MAX
2. FILTER
- A1. CALCULATE
2373. You have a Power BI semantic model named Model1 that runs in Import storage mode.
You need to reduce the size of Model1. The solution must NOT increase report query response times.
What should you do?- ARemove unnecessary columns.
- BUnpivot unnecessary columns.
- CRename unnecessary columns
- DChange Model1 to DirectQuery storage mode.
2474. You have a Power BI semantic model named Model1 that runs in Import storage mode.
You need to reduce the size of Model1.
Which two actions should you perform? Each correct answer presents a complete solution.
NOTE: Each correct selection is worth one point.- ASummarize the detail data.
- BUpgrade to Power BI premium.
- CImplement row-level security (RLS).
- DOptimize the column data types.
- EChange the active relationships between tables to inactive relationships.
2575. You have a Power BI semantic model that contains the following data.
You need to create a solution that meets the following requirements:
• Presents transaction amount totals for each month for the current and prior year
• Follows the star schema modeling approach
• Minimizes the data model size
Which three actions should you perform? Each correct answer presents part of the solution.
NOTE: Each correct selection is worth one point.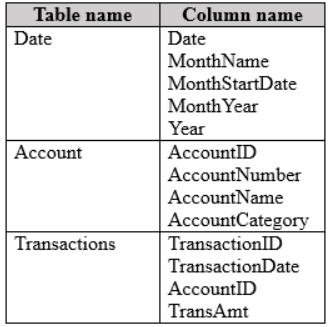
- ACreate one-to-many relationships between the tables.
- BIn the Transactions query, delete the TransactionID column.
- CIn the Date query, group by MonthNumber.
- DIn the Transactions query, group by AccountID and MonthStartDate for TransactionDate. Aggregate by summing the TransAmt column.
- EIn the Transactions query, add a column that contains the MonthStartDate value for TransactionDate.
- FCreate many-to-many relationships between the tables.
2676. You have a Power BI semantic model that contains three tables named Products, OrderHistory, and Date.
The Products table is a dimension table that contains the following columns:
• ProductID
• ProductName
The OrderHistory table is a fact table that contains the following columns:
• OrderID
• ProductID
• OrderDate
The Date table is a dimension table that contains the following columns:
• Year
• Date
• Week
• Month
You need to define a relationship from Products to OrderHistory and from OrderHistory to Date.
Which cardinality should you configure? To answer, select the appropriate options in the answer area.
NOTE: Each correct answer is worth one point.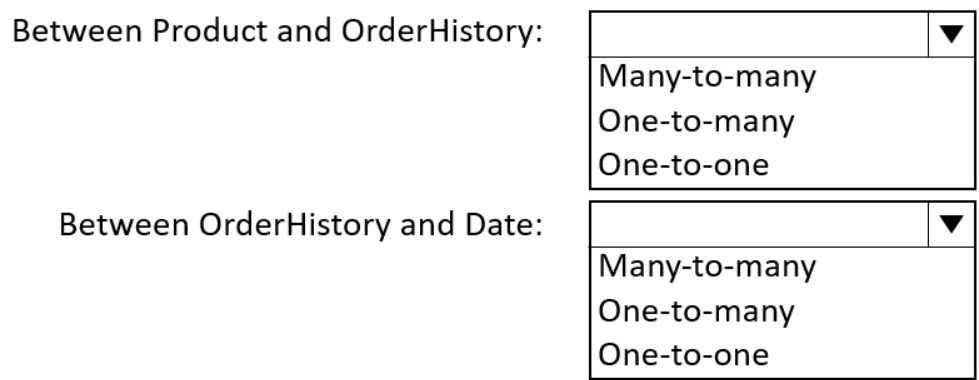
- A1. One-to-many
2. One-to-many - B1. One-to-many
2. One-to-one - C1. Many-to-many
2. One-to-many
- A1. One-to-many
2777. You plan to create a report that will display sales data from the last year for multiple regions.
You need to restrict access to individual rows of the data on a per region-basis by using roles.
Which four actions should you perform in sequence? To answer, move the appropriate actions from the list of actions to the answer area and arrange them in the correct order.
Select and Place: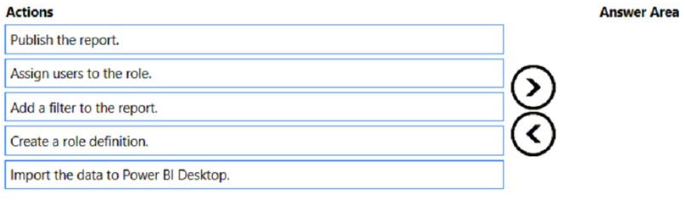
- AImport the data to Power BI Desktop.
Add a filter to the report.
Publish the report.
Assign users to the role. - BImport the data to Power BI Desktop.
Create a role definition.
Publish the report.
Assign users to the role. - CImport the data to Power BI Desktop.
Create a role definition.
Assign users to the role.
Publish the report.
- AImport the data to Power BI Desktop.
2878. You have a Power BI semantic model.
You need to create a column that will contain year-over-year (YOY) revenue. The column must contain a ratio of change factor compared to the previous year's monthly revenue.
How should you complete the DAX formula? To answer, select the appropriate options in the answer area.
NOTE: Each correct selection is worth one point.- A1. PARELLELPERIOD
2. DIVIDE - B1. SAMEPERIODLASTYEAR
2. CALCULATE - C1. SAMEPERIODLASTYEAR
2. DIVIDE
- A1. PARELLELPERIOD
2979. You use Microsoft Power BI Desktop to review the data shown in the following exhibit.
Use the drop-down menus to select the answer choice that completes each statement based on the information presented in the graphic.
NOTE: Each correct selection is worth one point.
You used [answer choice] on the Data table. -auto date/time
- bidirectional relationship
- quick measures
Configure the Mask as date table setting for the Date table will remove [answer choice]. - the Date table
- the Month End Date date hierarchy from the Data table
- the MonthStart Date column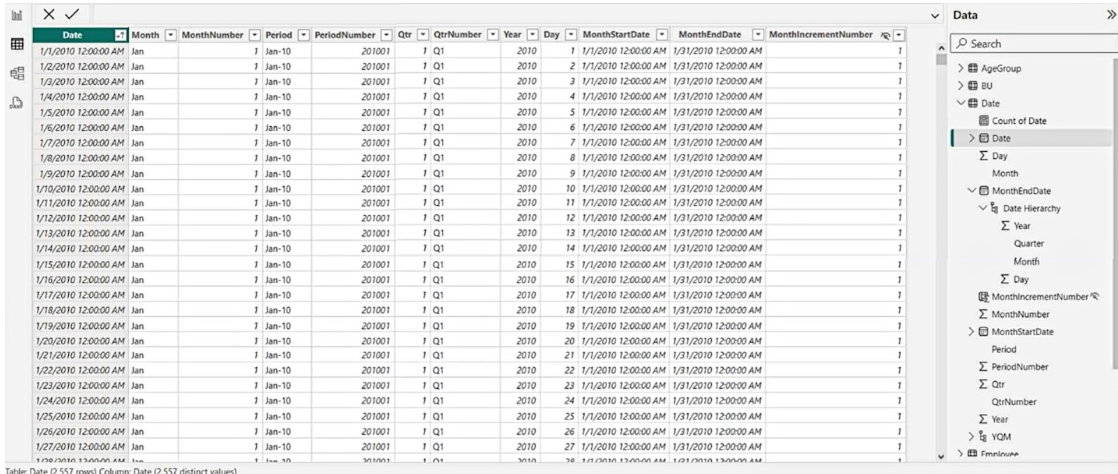
- A1. quick measures
2. the MonthStart Date column - B1. auto date/time
2. the MonthStart Date column - C1. quick measures
2. the Date table
- A1. quick measures
3080. You have a Power BI semantic model that contains two tables named Sales and Forecast. Both tables contain a date column.
You need to create a calculated table that will cover the range of dates in both tables.
How should you complete the DAX expression? To answer, select the appropriate options in the answer area.
NOTE: Each correct selection is worth one point.
- A1. CALENDARAUTO
2. MINX
3. MAXX - B1. DATEDIFF
2. MINX
3. MINX - C1. CALENDAR
2. MINX
3. MAXX
- A1. CALENDARAUTO
3181. You have a Power BI semantic model named Model1 that contains two tables named DimDate and FactSales. There is an active relationship between DimDate and FactSales. DimDate is marked as the date table. FactSales contains the following data.
Model1 contains the following measure.
Previous Year Sales = CALCULATE([Sales Amount], PREVIOUSYEAR('Date'[Date]))
You have a report that uses Model1. The report has a single report page that has a page level filter set to May 9, 2024. The result of the Previous Year Sales measure is displayed in a card visual.
Which value will appear in the card visual?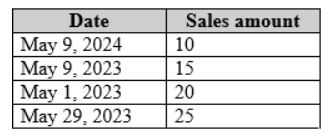
- A10
- B15
- C35
- D60
3282. You have a Power BI query named Expenses that imports the following data.
Users only use the date portion of the TransactionDate value when performing data analysis.
You need to minimize the model size without affecting the analysis.
Which two actions should you perform? Each correct answer presents part of the solution.
NOTE: Each correct selection is worth one point.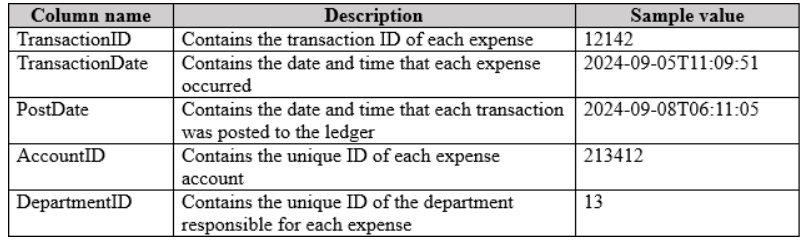
- AChange the data type of the TransactionDate column to Date.
- BChange the data type of the PostDate column to Date.
- CRemove the PostDate column.
- DRemove the TransactionID column.
3383. You have a Power BI semantic model that contains two tables named DimCustomer and FactOrderDetails.
The primary key of DimCustomer is CustomerID.
FactOrderDetails contains a column named CustomerID that can be used to relate to DimCustomer. Multiple rows in FactOrderDetails possibly have the same CustomerID value.
You need to create a relationship from FactOrderDetails to DimCustomer. The solution must optimize query performance.
What should you create?- Aan active, single-direction, many-to-one relationship
- Ban inactive, single-direction, one-to-many relationship
- Can active, single-direction, one-to-many relationship
- Dan active, bi-directional, many-to-one relationship
3484. You have a Power BI model that contains a table named Expenses. The table contains the following columns:
• Date
• Amount
• Category
• Expense ID
• Employee ID
Expenses are recorded by employees, and each expense has a unique expense ID.
You need to create a DAX measure that will calculate the total amount of expenses.
Which DAX expression should you use?- ASum(‘Expenses’[Amount])
- BMax(‘Expenses’[Amount])
- CSum(‘Expenses’[Expense ID])
- DCount(‘Expenses’[Amount])
3585. You have a semantic model named Model1 that contains the following tables.
There is an active relationship between SaleDate and Date.
There is an inactive relationship between ShippingDate and Date.
You need to create a new measure that will display the total amount of sales and support slicing by ShippingDate.
How should you complete the DAX expression? To answer, select the appropriate options in the answer area.
NOTE: Each correct selection is worth one point.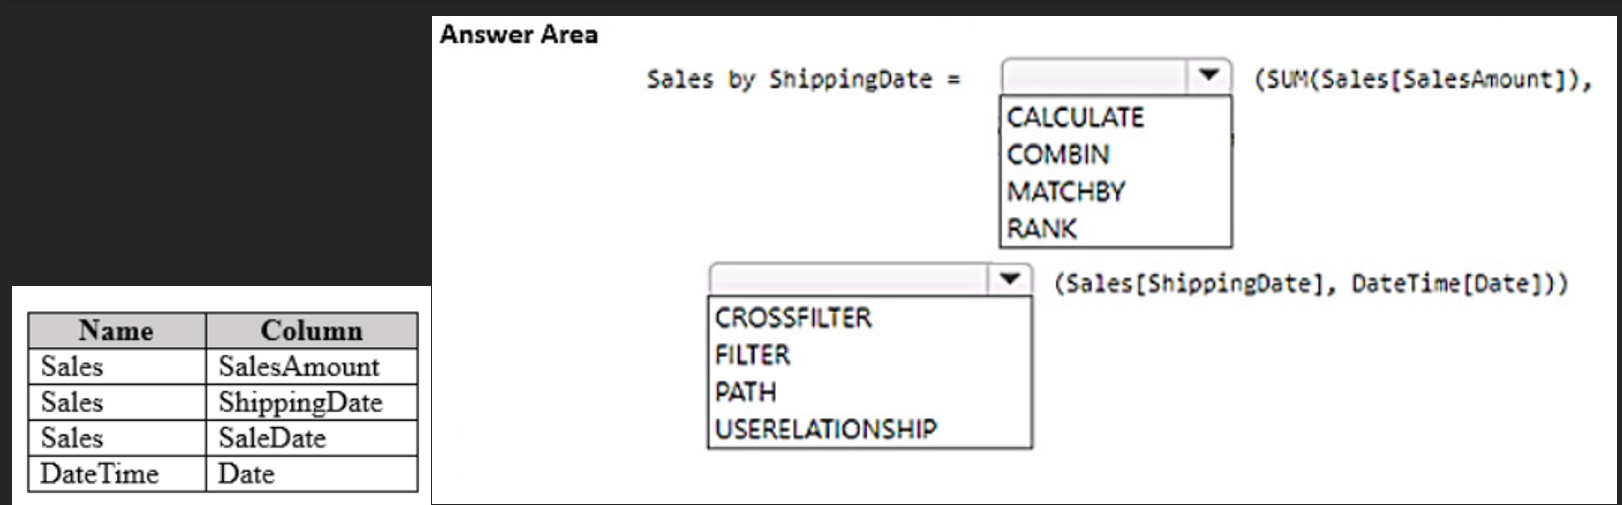
- A1. CALCULATE
2. FILTER - B1. CALCULATE
2. USERELATIONSHIP - C1. COMBIN
2. USERELATIONSHIP
- A1. CALCULATE
3686. You have a query in Power Query Editor that contains the following data.
You need to transform the data to appear as shown in the following table.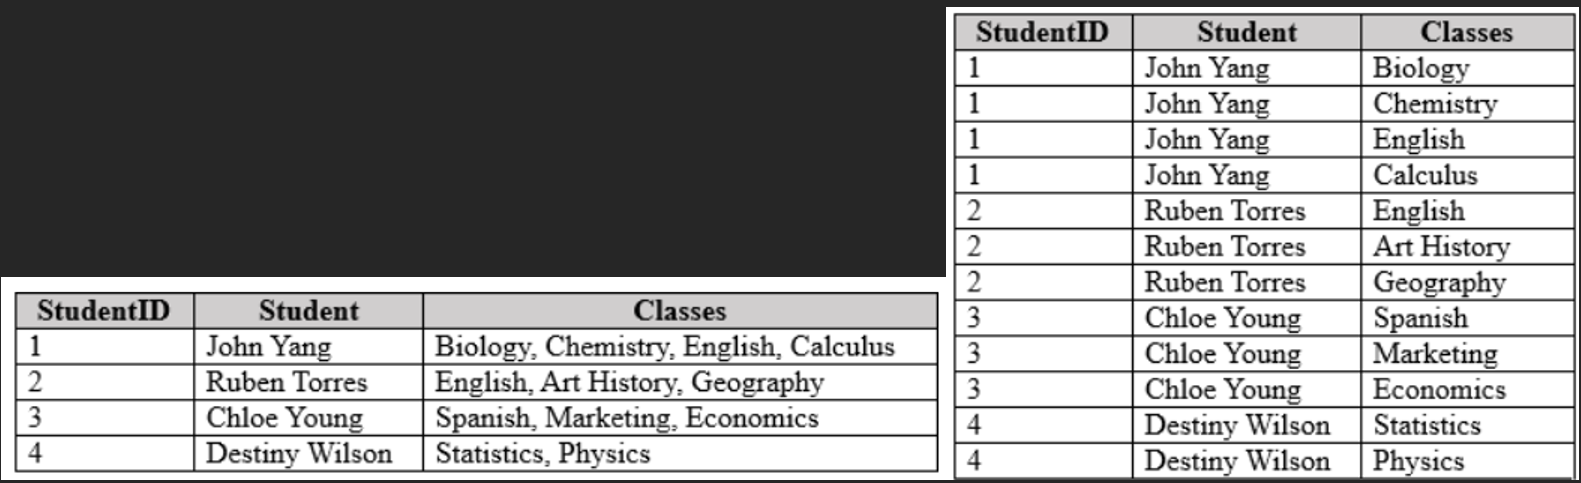
- ASplit the Classes column into rows by using a delimiter.
- BUnpivot the Classes column.
- CExtract the text between delimiters in the Classes column.
- DConvert the Classes column into a list.
3787. DRAG DROP -
You create a data model in Power BI.
Report developers and users provide feedback that the data model is too complex.
The model contains the following tables.
The model has the following relationships:
✑ There is a one-to-one relationship between Sales_Region and Region_Manager.
✑ There are more records in Manager than in Region_Manager, but every record in Region_Manager has a corresponding record in Manager.
✑ There are more records in Sales_Manager than in Sales_Region, but every record in Sales_Region has a corresponding record in Sales_Manager.
You need to denormalize the model into a single table. Only managers who are associated to a sales region must be included in the reports.
Which three actions should you perform in sequence? To answer, move the appropriate actions from the list of actions to the answer area and arrange them in the correct order.
NOTE: More than one order of answer choices is correct. You will receive credit for any of the correct orders you select.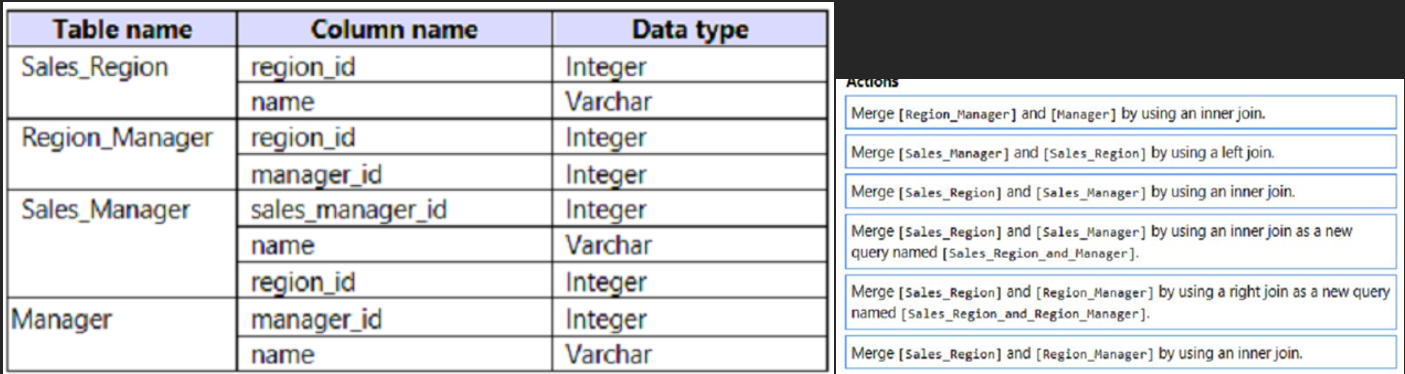
- AMerge [Region_Manager] and [Manager] by using an inner join.
Merge [Sales_Region] and [Sales_Manager] by using an inner join.
Merge [Sales_Region] and [Region_Manager] by using an inner join. - BMerge [Region_Manager] and [Manager] by using an inner join.
Merge [Sales_Manager] and [Sales_Region] by using an left join.
Merge [Sales_Region] and [Region_Manager] by using an inner join.
- AMerge [Region_Manager] and [Manager] by using an inner join.
3888. You have a Microsoft Fabric eventhouse named Eventhouse1 that contains high-velocity and high-volume data from IoT devices.
Eventhouse1 can be queried to deliver data to reports in near-real-time (NRT).
You plan to use Power BI Desktop to create a report that will contain both historical and live data.
You need to connect to Eventhouse1. The solution must minimize development effort.
What should you do?- ABuild a composite model.
- BUse DirectQuery connectivity mode.
- CUse Import connectivity mode.
3989. You have a Power BI semantic model that contains the following tables.
You need to define a relationship from FactSales to DimProduct. The solution must ensure the fastest DAX query performance.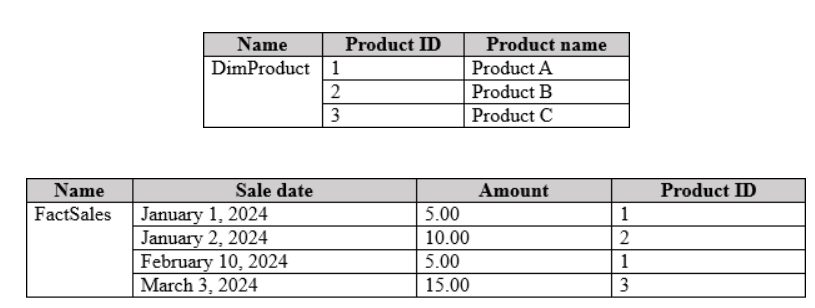
- Aone-to-many
- Bone-to-one
- Cmany-to-many
- Dmany-to-one
40 90. You have a Power BI semantic model that contains two tables named Dim Location and Fact Deliveries. The relationships between the tables are configured as shown in the following table.
The model contains one measure that has the following formula.
Deliveries = COUNTROWS(‘Fact Deliveries’)
You need to create a new measure that counts the number of deliveries based on the destination location.
How should you complete the DAX expression? To answer, drag the appropriate functions to the correct targets. Each function may be used once, more than once, or not at all. You may need to drag the split bar between panes or scroll to view content.
NOTE: Each correct selection is worth one point.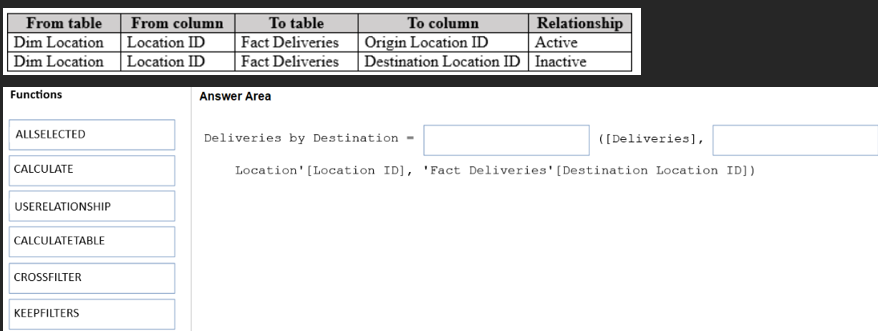
- ACALCULATE
USERELATIONSHIP - BCALCULATEABLE
USERELATIONSHIP - CCALCULATE
CROSSFILTER
- ACALCULATE
4191. You import a Microsoft Excel spreadsheet into Power Query Editor and name the query Sales_Spreadsheet.
Sales_Spreadsheet contains the following columns:
• Customer ID
• Customer Name
• Date
• Total Sales Amount
You plan to use the Sales Spreadsheet query to load two tables named Customer and Sales into the associated semantic model. The tables relate to each other on the Customer ID column of each query. The solution must meet the following requirements:
• The Customer query must contain the Customer ID and Customer Name columns.
• The Sales query must contain the Customer ID, Date, and Total Sales Amount columns.
• Power Query logic must be consolidated to avoid the duplication of logic across the queries and ensure that only one location is used to update the logic.
You need to identify how to create the Sales query, and what to do to the Sales_Spreadsheet query before loading the model?
What should you do? To answer, select the appropriate options in the answer area.
NOTE: Each correct selection is worth one point.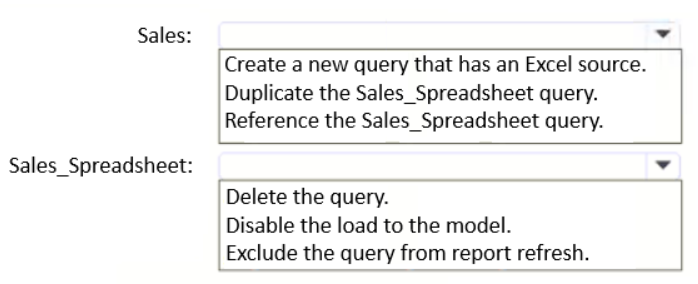
- Areference the Sales_Spreadsheet query
exclude the query from report refresh - Breference the Sales_Spreadsheet query
disable the load to the model - Cduplicate the Sales_Spreadsheet query
disable the load to the model
- Areference the Sales_Spreadsheet query
4292. You have a semantic model that has the relationships shown in the following exhibit.
Use the drop-down menus to select the answer choice that completes each statement based on the information presented in the graphic.
NOTE: Each correct selection is worth one point.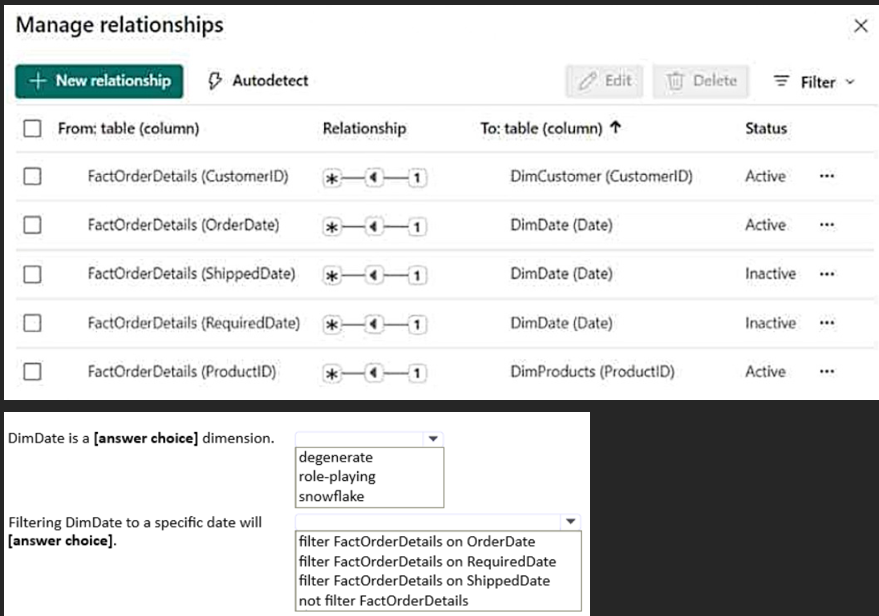
- A1. role-playing
2. filter FactOrderDetails on OrderDate - B1. role-playing
2. not filter FactOrderDetails - C1. snowflake
2. filter FactOrderDetails on OrderDate
- A1. role-playing
4393. You use Power Query Editor to ingest data into Power BI Desktop.
The total dataset contains 250,000 rows. All the rows match the format of the data as shown in the following exhibit.
You need to optimize the data model size of the table.
Which type of data should you use for the Value column and the Datetime column? To answer, select the appropriate options in the answer area.
NOTE: Each correct selection is worth one point.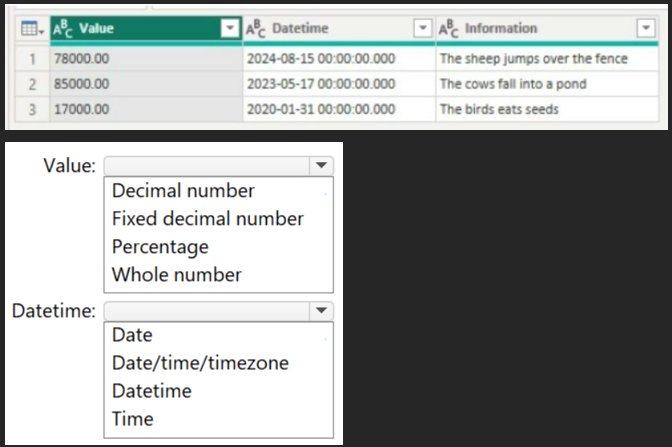
- ADecimal number
Date - BWhole number
Date - CWhole number
Datetime
- ADecimal number
4494. You have a Power BI semantic model that contains a table named Table1. Table1 runs in Import storage mode.
You need to update the model to change the storage mode of Table1 to DirectQuery.
What should you do?- ADelete Table1, and then add the table to the model again in DirectQuery storage mode.
- BFrom Power Query Editor, duplicate the query for Table1.
- CFrom Model view, change the storage mode of Table1 to DirectQuery.
- DAdd an aggregation table to the model.
4595. You have a Power BI semantic model that contains the following tables.
All the tables use the same data source.
You need to reduce the number of limited relationships in the model by changing the storage mode of certain tables. The solution must NOT affect the latency of the data.
Which storage mode should you select for the Customer and Geography tables? To answer, select the appropriate options in the answer area.
NOTE: Each correct selection is worth one point.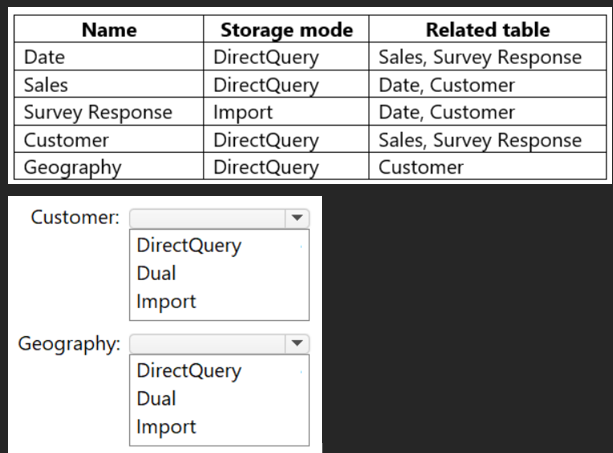
- ADirectQuery
Dual - BDual
DirectQuery - CDual
Import
- ADirectQuery
4696.
You have a semantic model that contains a table named Sales. The table contains the following columns:
• Order ID
• Product ID
• Sales Date
• Sales Amount
You need to create a DAX measure that will return the total sales amount for the same dates from the previous year.
How should you complete the measure? To answer, select the appropriate options in the answer area.
NOTE: Each correct selection is worth one point.
- ACALCULATE
SAMEPERIODLASTYEAR - BCALCULATEABLE
SAMEPERIODLASTYEAR - CSUMX
SAMEPERIODLASTYEAR
- ACALCULATE
4797. You have a Power BI semantic model that contains the following table named Employees.
An employee is considered active if the TermDate column for that employee contains no value.
You need to create a DAX measure that will count the number of active employees.
How should you complete the DAX expression? To answer, select the appropriate options in the answer area.
NOTE: Each correct selection is worth one point.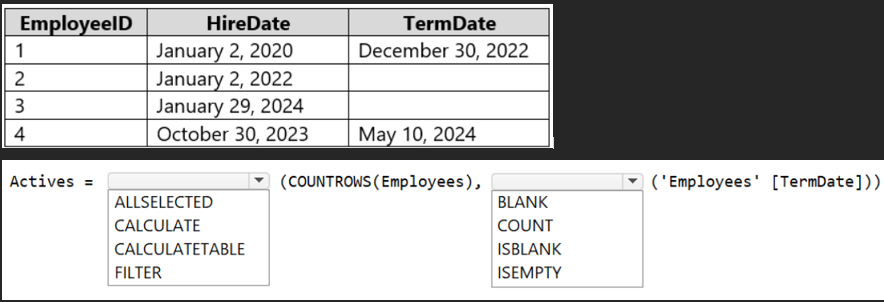
- ACALCULATE
ISBLANK - BCALCULATEABLE
ISBLANK - CCALCULATE
BLANK
- ACALCULATE
4898. You have a Microsoft Power BI report. The size of PBIX file is 550 MB. The report is accessed by using an App workspace in shared capacity of powerbi.com.
The report uses an imported dataset that contains one fact table. The fact table contains 12 million rows. The dataset is scheduled to refresh twice a day at 08:00 and 17:00.
The report is a single page that contains 15 AppSource visuals and 10 default visuals.
Users say that the report is slow to load the visuals when they access and interact with the report.
You need to recommend a solution to improve the performance of the report.
What should you recommend?- AChange any DAX measures to use iterator functions.
- BEnable visual interactions.
- CReplace the default visuals with AppSource visuals.
- DSplit the visuals onto multiple pages.
4999. You have a Power BI semantic model that has the tables and relationships shown in the following exhibit.
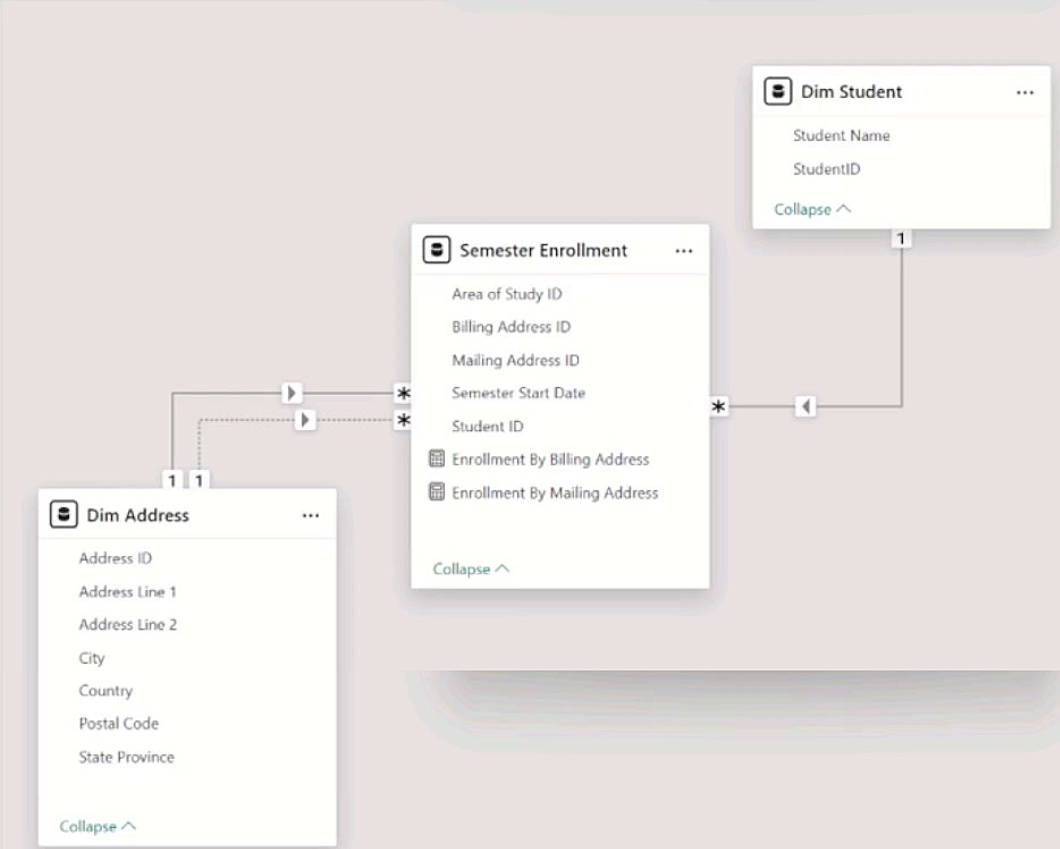
- AType 2 slowly changing dimension (SCD)
- Bjunk dimension
- Crole-playing dimension
- Ddegenerate dimension
50100. You are creating a Microsoft Power BI imported data model to perform basket analysis. The goal of the analysis is to identify which products are usually bought together in the same transaction across and within sales territories.
You import a fact table named Sales as shown in the exhibit. (Click the Exhibit tab.)
The related dimension tables are imported into the model.
Sales contains the data shown in the following table.
You are evaluating how to optimize the model.
For each of the following statements, select Yes if the statement is true. Otherwise, select No.
NOTE: Each correct selection is worth one point.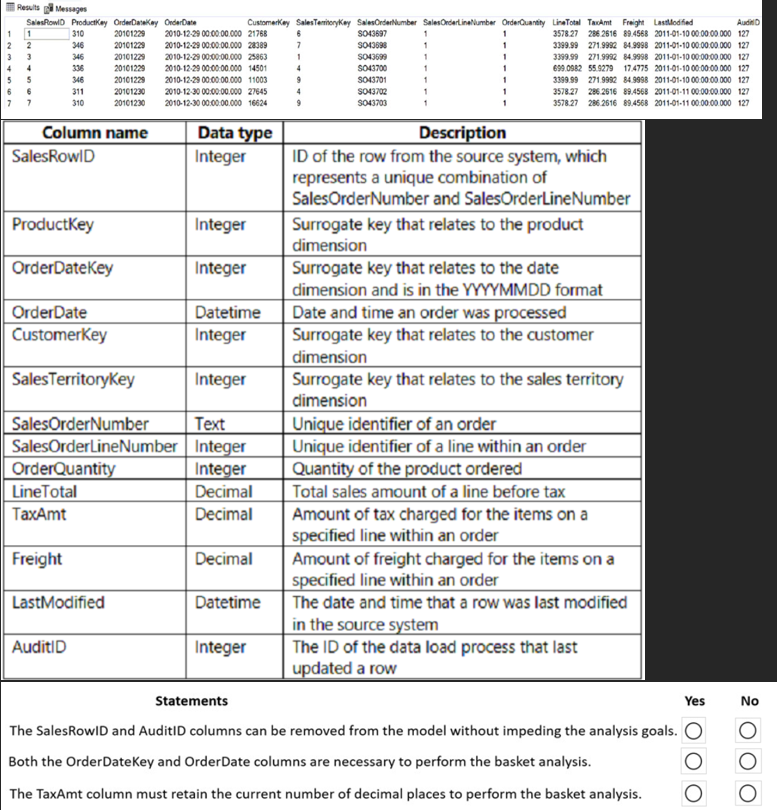
- Ayes no no
- Bno yes no
- Cyes yes yes
- Dno no no
Information
- Description
- Quiz on p51-100, created by Cristiana Ioana on 12/01/2026.
- Author
- Cristiana Ioana
- Language
- English
- Views
- 3
- Rating
- No ratings yet Rate this quiz