
Quiz
P251-300
Create a free account to finish this quiz
Save your progress and see your final score.
Already have an account? Sign in
Questions in this quiz (50)
1251. You have the dashboard shown in the following exhibit.
You need to modify the dashboard to display as shown in the following exhibit.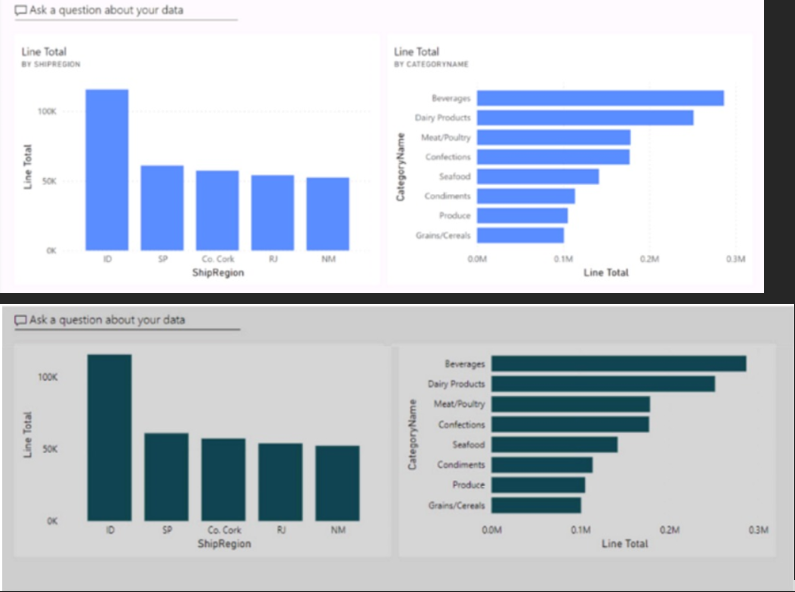
- ACreate and apply a custom dashboard theme.
- BChange the colors of the visuals in the report.
- CApply the Dark dashboard theme.
- DUpload a snapshot image of the dashboard.
2252. You need to create a Power BI theme that will be used in multiple reports. The theme will include corporate branding for font size, color, and bar chart formatting.
What should you do?- AFrom Power BI Desktop, customize the current theme.
- BFrom Power BI Desktop, use a built-in report theme.
- CCreate a theme as a PBIVIZ file and import the theme into Power BI Desktop
- DCreate a theme as a JSON file and import the theme into Power BI Desktop
3253. You have a Power BI report that contains one page. The page contains two line charts and one bar chart.
You need to ensure that users can perform the following tasks for all three visuals:
• Switch the measures used in the visuals.
• Change the visualization type.
• Add a legend.
The solution must minimize development effort.
What should you do?- ACreate a bookmark for each acceptable combination of visualization type, measure, and legend in the bar chart.
- BEdit the interactions between the three visuals.
- CEnable personalization for the report.
- DEnable personalization for each visual.
4254. Note: This question is part of a series of questions that present the same scenario. Each question in the series contains a unique solution that might meet the stated goals. Some question sets might have more than one correct solution, while others might not have a correct solution.
After you answer a question in this section, you will NOT be able to return to it. As a result, these questions will not appear in the review screen.
You have a clustered bar chart that contains a measure named Salary as the value and a field named Employee as the axis. Salary is present in the data as a numerical amount representing US dollars.
You need to create a reference line to show which employees are above the median salary.
Solution: You create a median line by using the Salary measure.
Does this meet the goal?- Ayes
- Bno
5255. You have a Power BI report that contains a table visual with a measure named Revenue. The Revenue measure returns values within a range of 0 to 5.
You need to format the visual so that the Revenue column displays a specific background color based on the value range shown in the following table.
Which three actions should you perform in sequence in Power BI Desktop? To answer, move the appropriate actions from the list of actions to the answer area and arrange them in the correct order.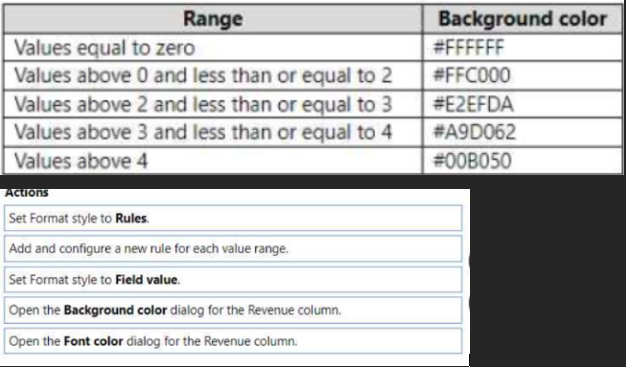
- AOpen the Background color dialog for the Revenue column.
Set Format style to Rules.
Add and configure a new rule for each value range. - BOpen the Font Color dialog for the Revenue column.
Set Format style to Field Value.
Add and configure a new rule for each value range.
- AOpen the Background color dialog for the Revenue column.
6256. You have a Power BI report that contains four pages.
All the pages contain a slicer for a field named Country.
You need to ensure that when a user selects a country on page 1, the selection is retained on page 2 and page 3. The solution must prevent page 4 from being affected by selections on the other pages.
What should you do?- ARemove the Country slicer from page 1, page 2, and page 3. Add the Country field to the page-level filters.
- BRemove the Country slicer from page 1, page 2, and page 3. Add the Country field to the report-level filters.
- CMove the Country slicer from page 2 and page 3 to page 1
- DSync the Country slicer on page 1, page 2, and page 3.
7257. You use Power BI Desktop to create a Power BI data model and a blank report.
You need to add the Word Cloud visual shown in the following exhibit to the report.
The solution must minimize development effort.
Which three actions should you perform in sequence? To answer, move the appropriate actions from the list of actions to the answer area and arrange them in the correct order.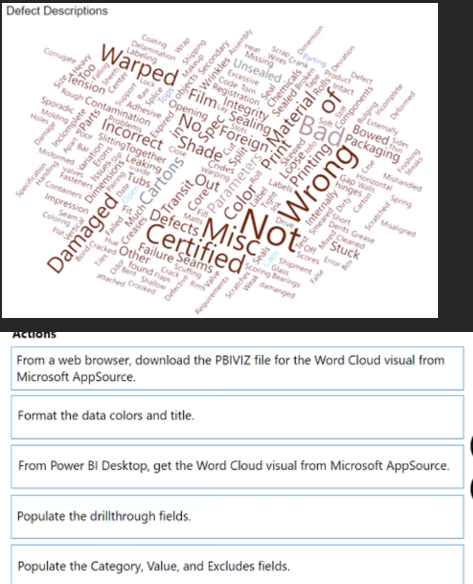
- AFrom Power BI Desktop, get the Word Cloud visual from Microsoft AppSource
Populate the drillthrough fields
Format the data colors and title - BFrom Power BI Desktop, get the Word Cloud visual from Microsoft AppSource
Populate the Category, Value, and Excludes fields
Format the data colors and title - CFrom a web browser, download the PBIVIZ file for the Word Cloud visual from Microsoft AppSource
Populate the Category, Value, and Excludes fields
Format the data colors and title
- AFrom Power BI Desktop, get the Word Cloud visual from Microsoft AppSource
8258. You build a report to help the sales team understand its performance and the drivers of sales.
The team needs to have a single visualization to identify which factors affect success.
Which type of visualization should you use?- AKey influencers
- BLine and clustered column chart
- CQ&A
- DFunnel chart
9259. You have a Power BI report that contains five bookmarks.
You need to add an object to the report from which users can navigate between three specific bookmarks.
How should you complete the task? To answer, drag the appropriate actions to the correct steps. Each action may be used once, more than once, or not at all. You may need to drag the split bar between panes or scroll to view content.
NOTE: Each correct selection is worth one point.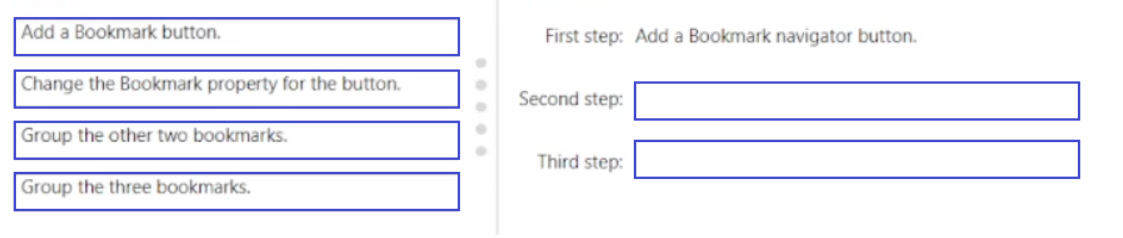
- AGroup the three bookmarks
Change the Bookmark property for the button - BGroup the other two bookmarks
Change the Bookmark property for the button
- AGroup the three bookmarks
10260. You plan to use Power BI to create sales invoices for customers. The solution must meet the following requirements:
• Sales invoices must be exported in a PDF format.
• The PDF exports must show all columns and rows clearly.
What should you create?- Aa paginated report that contains a tablix
- Ba dashboard that contains a table
- Can interactive report that contains a table
- Dan interactive report that contains a matrix
11261. You have a Power BI report that contains three pages. The pages are used to analyze sales across various countries.
You add a slicer named Country to each page of the report.
You need to configure the report to meet the following requirements:
• When a user selects a country on the first page, the report must filter the other pages.
• The second and third pages must display only the filtered results.
Which task should you perform for each requirement? To answer, drag the appropriate task to the correct requirement. Each task may be used once, more than once, or not at all. You may need to drag the split bar between panes or scroll to view content.
NOTE: Each correct selection is worth one point.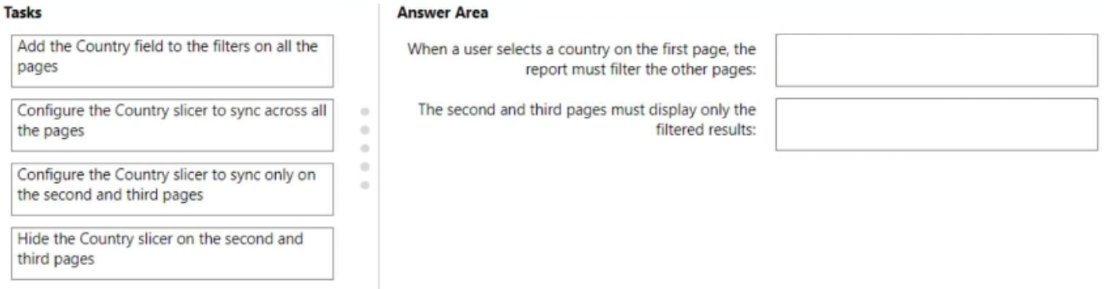
- AAdd the Country field to the filters on all the pages
Configure the Country slicer to sync only on the second and third pages - BAdd the Country field to the filters on all the pages
Hide the Country slicer on the second and third pages
- AAdd the Country field to the filters on all the pages
12262. You have a Power BI report that contains a page. The page contains the following:
• A shape named Shape1
• A card named Sales Summary
• A clustered bar chart named Sales by Region
You need to ensure that Sales Summary renders on top of Shape1.
What should you modify?- ATab order in the Selection pane
- BLayer order in the Selection pane
- CMaintain layer order in the General visual settings
- DVertical alignment in the Canvas settings
13263. You have a Power BI report named Report1 and a dashboard named Dashboard1. Report1 contains a line chart named Sales by month.
You pin the Sales by month visual to Dashboard1.
In Report1, you change the Sales by month visual to a bar chart.
You need to ensure that the bar chart displays on Dashboard1.
What should you do?- ARefresh the dataset used by Report1 and Dashboard1.
- BPin the Sales by month bar chart to Dashboard1.
- CSelect Refresh visuals for Dashboard1.
- DEdit the details for the dashboard tile of Dashboard1.
14264. In Power BI Desktop, you are creating a report that will contain three pages.
You need to create a custom tooltip page and prepare the page for use.
Which three actions should you perform? Each correct answer presents part of the solution.
NOTE: Each correct selection is worth one point.- AFor the tooltip page, set Allow use as tooltip to On.
- BFor the target page, set Allow use as tooltip to On.
- CConfigure filters on the target visual.
- DFor the tooltip page, configure filters.
- EAdd and configure visuals on the tooltip page.
15265. You need to use AI insights to add a column of enhanced data based on the customer feedback. The solution must identify the following:
• What the customers most often provide feedback about
• Whether the customers like your company’s product
• The language of the feedback
Which AI insights service should you use for each output? To answer, drag the appropriate services to the correct outputs. Each service may be used once, more than once, or not at all. You may need to drag the split bar between panes or scroll to view content.
NOTE: Each correct selection is worth one point.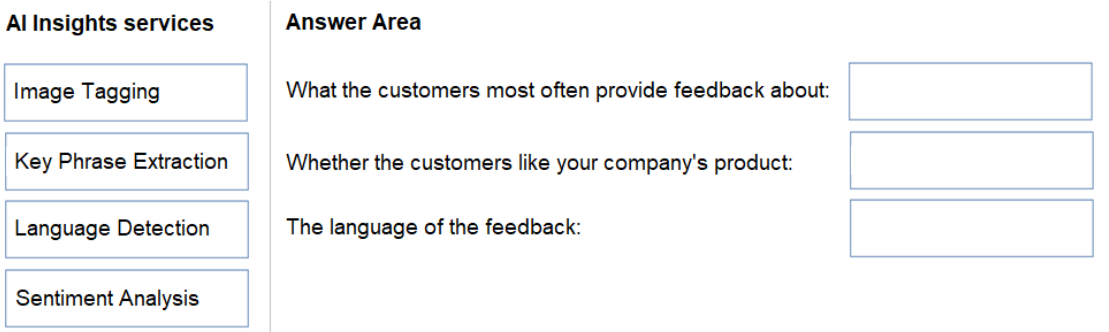
- AKey Phrase Extraction
Sentiment Analysis
Language Detection - BImage Tagging
Sentiment Analysis
Language Detection
- AKey Phrase Extraction
16266. You have a Power BI report named ReportA.
You have a Power BI tenant that allows users to export data.
You need to ensure that consumers of ReportA cannot export any data from visuals.
Which two actions should you perform? Each correct answer presents a complete solution.
NOTE: Each correct selection is worth one point.- AFrom Power BI Desktop, modify the Report settings.
- BFrom Power BI Desktop, modify the Data Load settings.
- CFrom the Power BI service, modify the dataset permissions.
- DFrom the Power BI service, modify the Report settings.
17267. You have a Power BI report that will be rendered on a vertical display.
You need to maximize the portion of the screen area used by the report.
What should you do?- AFrom the Canvas background setting of Power BI Desktop, configure the Image fit setting.
- BFrom the Canvas settings of Power BI Desktop, set a custom width and height.
- CFrom Power BI Desktop, select Personalize visuals.
- DFrom the Power BI service, enable the Pages pane.
18268. You need to create a visual that compares profit across 10 product categories fora selected quarter.
What is the best visual to use to achieve the goal?- Aan area chart
- Ba funnel chart
- Ca clustered bar chart
- Da line chart
19269. You have a table that contains the following three columns:
City -
Question
✑ Total Sales
✑ Occupation
You need to create a key influencers visualization as shown in the exhibit. (Click the Exhibit tab.)
How should you configure the visualization? To answer, select the appropriate options in the answer area.
NOTE: Each correct selection is worth one point.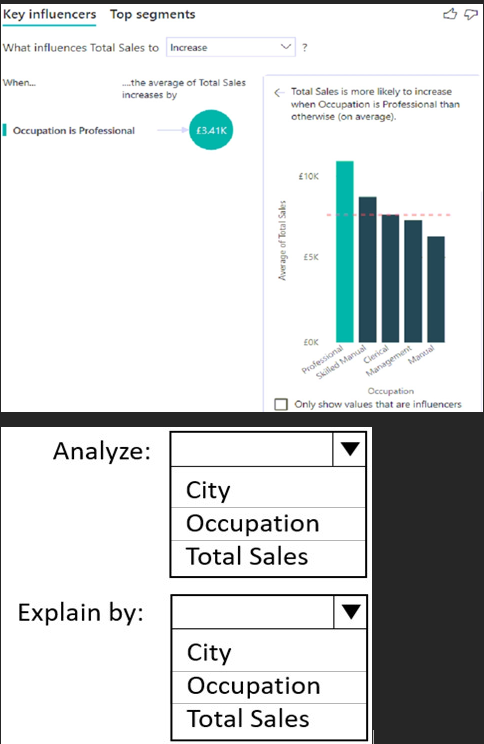
- ATotal Sales
Occupation - BOccupation
Total Sales - COccupation
City
- ATotal Sales
20270. You have a Power BI dataset named Finance that is hosted in a Power BI workspace.
The finance team at your company is NOT currently a member of any Power BI workspace roles.
You need to enable the finance team to use Microsoft Excel to analyze the Finance dataset.
What should you do?- AGrant the finance team build permissions to the Finance dataset.
- BProvide an Excel workbook that is connected to the Finance dataset.
- CCreate a row-level security (RLS) role and add the finance team to the role as members.
- DGrant the finance team write permissions to the Finance dataset.
21271. You have a Power BI report that contains a visual. The visual contains a measure.
You need to ensure that the report meets the following requirements:
• All values must be set to two decimal places.
• All negative values must be displayed in red font and parentheses.
Which two actions should you perform? Each correct answer presents part of the solution.
NOTE: Each correct selection is worth one point.- AFor the visual, apply conditional formatting to the background color.
- BConfigure the measure to use a custom format.
- CFor the visual, apply conditional formatting to the font color.
- DFor the visual, set Value decimal places to 2.
22272. You are using Power Query Editor to preview the data in a column named Max Temp. The column statistics and value distribution are shown in the following exhibit.
Use the drop-down menus to select the answer choice that completes each statement based on the information presented in the graphic.
NOTE: Each correct selection is worth one point.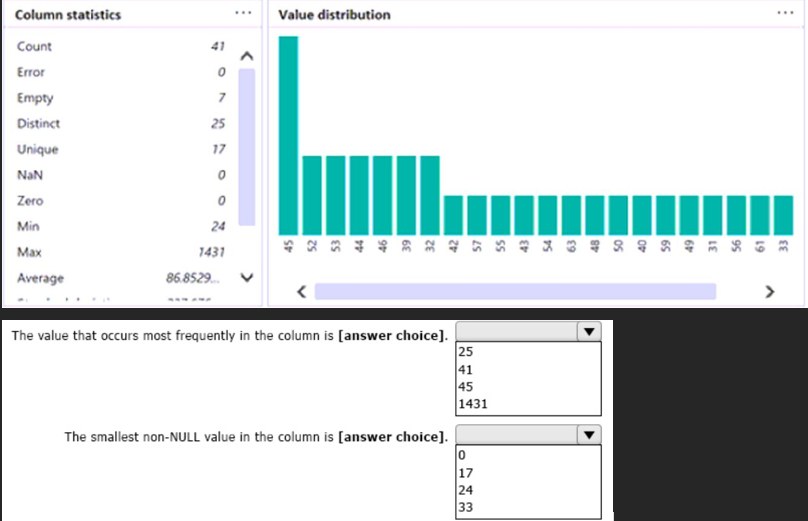
- A45
24 - B41
24 - C41
0
- A45
23273. You have a Power BI report that contains a page. The page contains the following visuals:
• A card
• A matrix
• A bar chart
You need to configure the page to ensure that the card and the bar chart are unaffected when a user drills down in the matrix. The card and the bar chart must change when a user selects a cell in the matrix.
What should you configure? To answer, select the appropriate options in the answer area.
NOTE: Each correct selection is worth one point.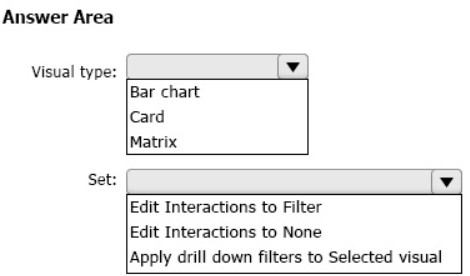
- AMatrix
Edit Interactions to None - BMatrix
Apply drill down filters to Selected Visual - CBar chart
Apply drill down filters to Selected Visual
- AMatrix
24274. You have a Power BI model that contains two tables named Population and Date.
The Population table contains two columns named PopulationAmount and DateKey.
DateKey contains date values that represent the first day of a year and are used to create a many-to-one relationship with the Date table.
The Power BI model contains two measures that have the following definitions.
Total Population = Sum(‘Population’[PopulationAmount])
2023 Population = CALCULATE([Total Population], ‘Date'[Year] = 2023)
You create a table visual that displays Date[Year] and [2023 Population].
What will the table visual show?- Aone row per year that contains blank values for every year except 2023
- Bone row per date that contains the population value for the corresponding year repeated in each row
- Ca single row for the year 2023 that contains the related population value
- Done row per year that contains the same value repeated for each year
25275. You have a Power BI dataset that contains quarterly sales performance data.
You need to enable managers to review the data in a format that meets the following requirements:
• Is optimized for printing.
• Renders data in Microsoft Excel, Word, PowerPoint, and PDF formats.
What should you create?- Aa template app
- Ba dashboard
- Ca paginated report
- Dan interactive report
26276. You have a Power BI report that contains the visuals shown in the following table.
You need to modify the location of each visual.
What should you modify for each visual?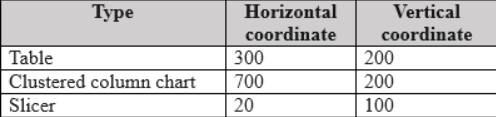
- Athe layer order
- Bthe padding
- Cthe position
- Dthe tab order
27277. You have a Power BI report. The report contains a line chart that displays sales data for several regions.
You need to add an element to the report that will enable users to filter the sales data to include only a selected region.
Which two elements achieve the goal? Each correct answer presents a complete solution.
NOTE: Each correct selection is worth one point.- Aa slicer visual
- Ba drillthrough filter
- Ca table visual
- Da card visual
- Ea Key Performance Indicator (KPI) visual
28278.
You plan to use Power BI to create a quarterly profit report that meets the following requirements:
• Emphasizes the percentage of total profits contributed by each product category in dollars and as a percentage
• Compares profit margins across sales regions
Which type of visual should you use for each requirement? To answer, drag the appropriate visuals to the correct requirements. Each visual may be used once, more than once, or not at all. You may need to drag the split bar between panes or scroll to view content.
NOTE: Each correct selection is worth one point.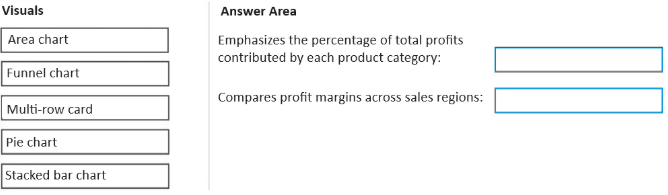
- Apie chart
stacked bar chart - Barea chart
stacked bar chart - Cpie chart
funnel chart
- Apie chart
29279. You have the CSV file shown in the following table.
You use Power Query Editor to preview the data in the file.
You need to transform the data to meet the following requirements:
• The first column must contain the month.
• The second column must contain the year.
• The third column must contain the order amount for the month and year.
Which transformation should you use first?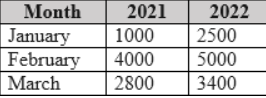
- Aremove
- Bunpivot
- Ctranspose
- Dpivot
30280. You are using the key influencers visual to identify which factors affect the quantity of items sold in an order.
You add the following fields to the Explain By field:
✑ Customer Country
✑ Product Category
✑ Supplier Country
✑ Sales Employee
✑ Supplier Name
✑ Product Name
✑ Customer City
The key influencers visual returns the results shown in the following exhibit.
What can you identify from the visual?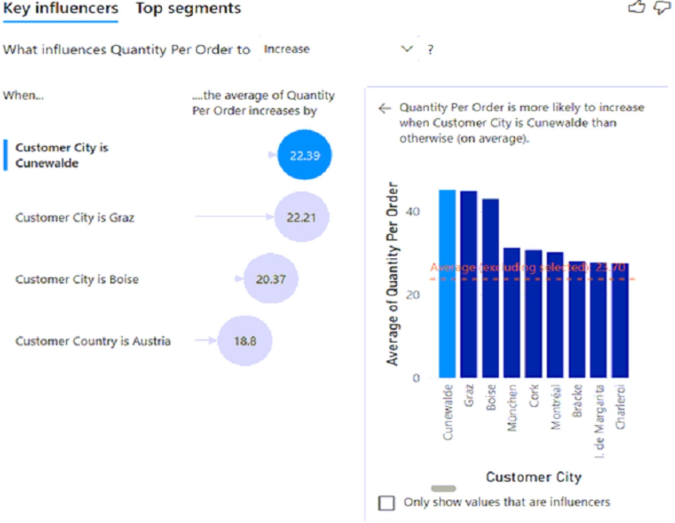
- ACustomers in Austria order 18.8 more units than the average order quantity.
- BCustomers in Boise order 20.37 percent more than the average order quantity.
- CProduct Category positively influences the quantity per order.
- DCustomers in Cork order lower quantities than average.
31281. You are creating a Power BI single-page report.
Some users will navigate the report by using a keyboard, and some users will navigate the report by using a screen reader.
You need to ensure that the users can consume content on a report page in a logical order.
What should you configure on the report page?- Athe layer order
- Bthe X position
- Cthe bookmark order
- Dthe tab order
32282.You are configuring a Power BI report for accessibility as shown in the following table.
You need to change the default colors of all three visuals to make the report more accessible to users who have color vision deficiency.
Which two settings should you configure in the Customize theme window? Each correct answer presents part of the solution.
NOTE: Each correct selection is worth one point.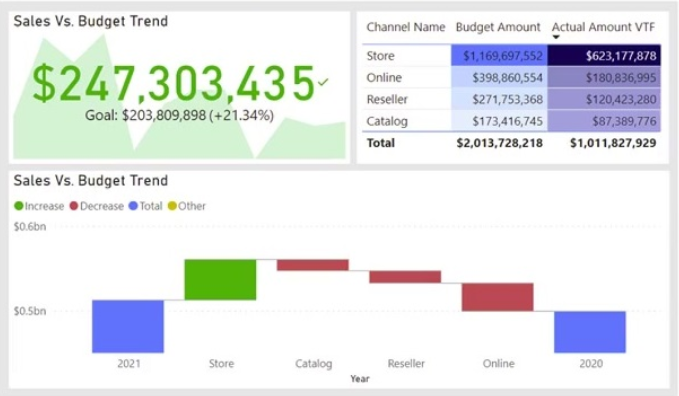
- AFirst-level elements colors
- BTheme colors
- CDivergent colors
- DSentiment colors
33283. You have a Power BI workspace that contains a semantic model and a report named Sales report.
All users in the sales department are assigned the Viewer role for the workspace.
The Sales report is configured as shown in the Sales report exhibit. (Click the Sales report tab.)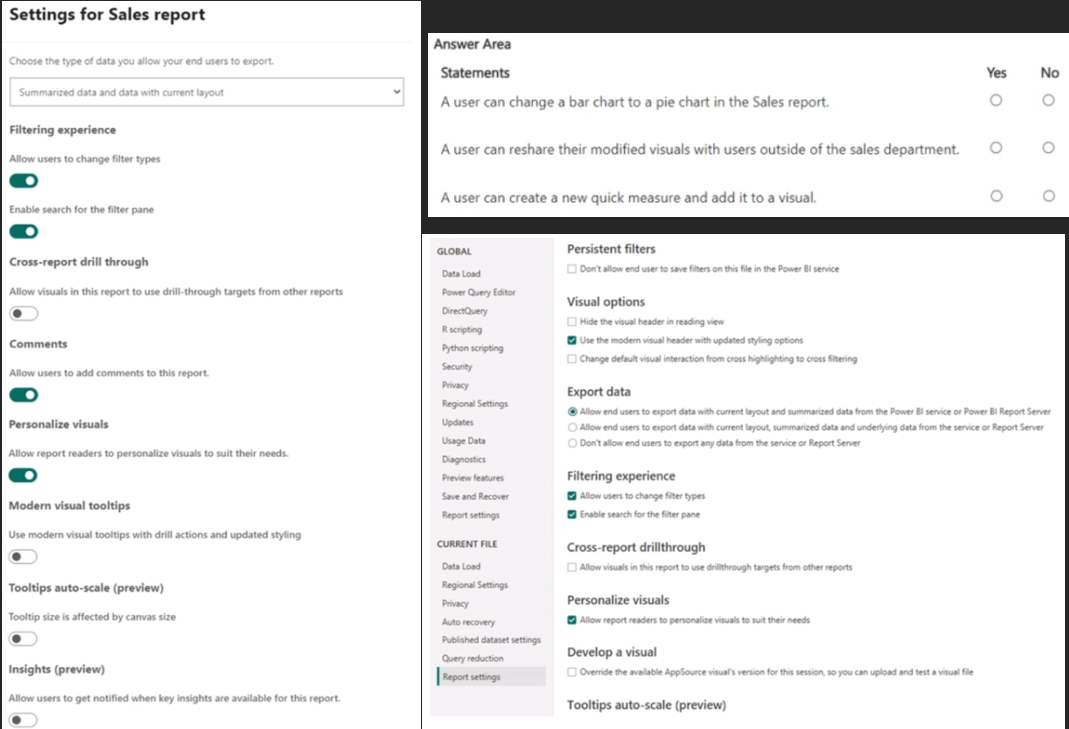
- Ayes no no
- Bno yes no
- Cno no yes
- Dyes yes yes
34284. You need to use Power BI to create a visual that will allow users to compare the sales performance of five sales regions for the current month.
Which visual should you use?- Aa line chart
- Ba stacked bar chart
- Ca 100% stacked bar chart
- Da waterfall chart
35285. You have a Power BI workspace.
You need to create two reports that meet the following requirements:
• Report1: Optimized for printing and can be delivered to users via a scheduled email subscription
• Report2: Optimized for dynamic user interactivity
Which format should you use for each report? To answer, select the appropriate options in the answer area.
NOTE: Each correct selection is worth one point.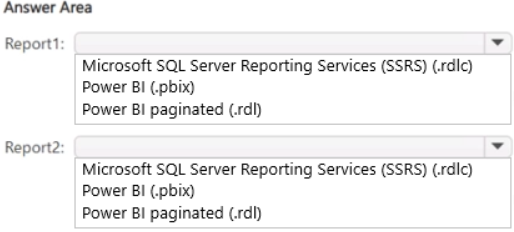
- Apaginated report
power bi - Bpower bi
paginated report - Cssrs
power bi
- Apaginated report
36286. You have a Power BI report that contains the table shown in the following exhibit.
The table contains conditional formatting that shows which stores are above, near, or below the monthly quota for returns.
You need to ensure that the table is accessible to consumers of reports who have color vision deficiency.
What should you do?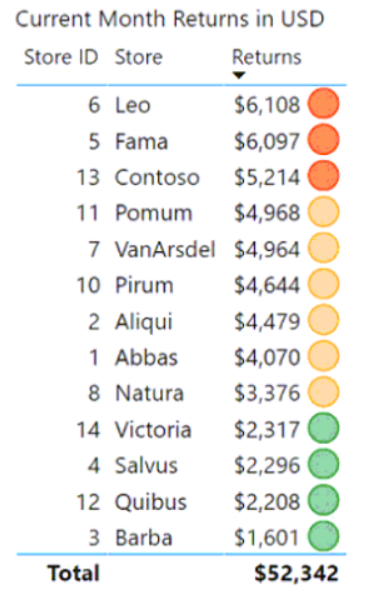
- AMove the conditional formatting icons to a tooltip report.
- BAdd alt text that lists the values in the table.
- CChange the icons to use a different shape for each color.
- DRemove the icons and use red, yellow, and green background colors instead.
37287. You have a Power BI report that contains one visual.
You need to provide users with the ability to change the visual type without affecting the view for other users.
What should you do?- AFrom the Bookmarks pane, select Focus mode, and then select Add.
- BFrom Report settings, select Personalize visuals.
- CFrom Visual options in Report settings, select Use the modern visual header with updated styling options.
- DFrom Tabular Editor, create a new perspective.
38288. You have a Power BI report that contains the table visual shown in the following exhibit.
You need to modify the visual to display as shown in the following exhibit.
How should you configure the visual? To answer, select the appropriate options in the answer area.
NOTE: Each correct selection is worth one point.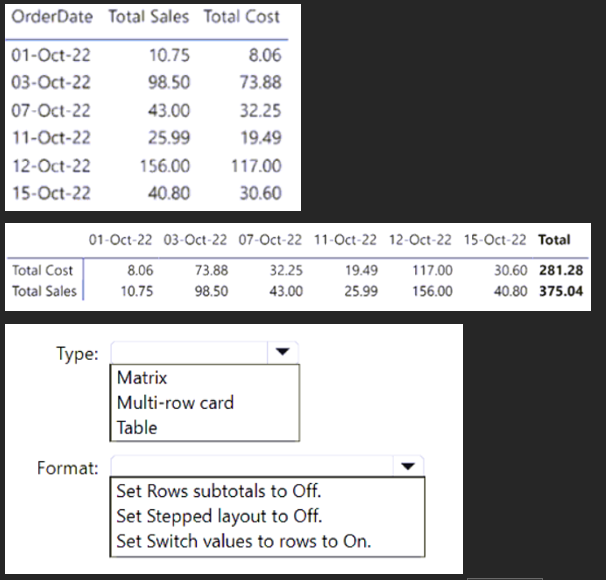
- AMatrix
Set Switch values to rows to On - BTable
Set Switch values to rows to On - CMatrix
Set Rows subtotals to Off
- AMatrix
39289. You have a Power BI report that contains a card. The card displays the value for year-to-date revenue.
You need to ensure that screen reader users can read the value when initially interacting with the card. The value must stay updated as the dataset is refreshed.
What should you do?- AConvert the card into a text box.
- BAdd the value to the chart title text.
- CPopulate the alt text with a static value.
- DPopulate the alt text by using conditional formatting with a DAX measure.
40290. You have a Power BI report that contains a table visual. The visual contains a column.
The column contains whole numbers ranging from of 1 to 20.
You need to use conditional formatting to meet the following requirements:
• Visually compare the values without having to read the text containing the number.
• Show a different format for each distinct value.
• Hide the numeric value of ColumnA.
• Minimize development effort.
Which formatting should you use?- Afont color
- Bicons
- Cdata bars
- Dbackground color
41291. You have a report that contains four pages. Each page contains slicers for the same four fields.
Users report that when they select values in a slicer on one page, the selections are not persisted on other pages.
You need to recommend a solution to ensure that users can select a value once to filter the results on all the pages.
What are two possible recommendations to achieve this goal? Each correct answer presents a complete solution.
NOTE: Each correct selection is worth one point.- ACreate a bookmark for each slicer value.
- BReplace the slicers with report-level filters.
- CSync the slicers across the pages.
- DReplace the slicers with page-level filters.
- EReplace the slicers with visual-level filters.
42292. Location.
The column statistics and value distributions of Resource Location appear as shown in the following exhibit.
Use the drop-down menus to select the answer choice that completes each statement based on the information presented in the graphic.
NOTE: Each correct selection is worth one point.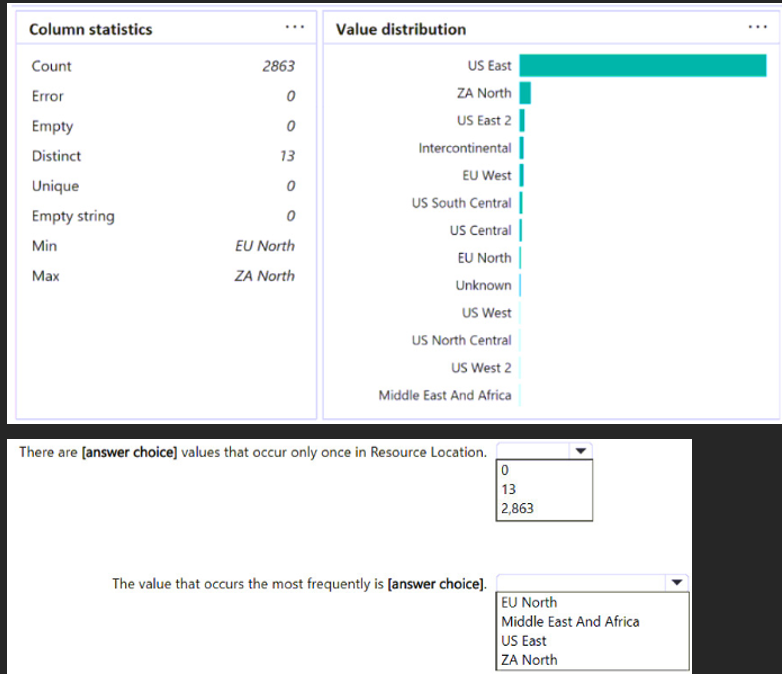
- A0
US East - B13
US East - C0
EU North
- A0
43293. You have a Power BI report that contains the visual shown in the following exhibit.
You need to make the visual more accessible to users who have color vision deficiency.
What should you do?- AChange the font color of values in the Sales column to white.
- BChange the red background color to orange.
- CAdd additional measures to the table values.
- DAdd icons to represent the sales status of each product.
44294. You have a Power BI app that contains a report named Report1.
You add a new page to Report1.
You need to ensure that users can view the new page. The solution must minimize administrative effort.
What should you do?- AUpdate the audience in the app.
- BUpdate the app.
- CUpdate the contact information in the app.
- DUnpublish and create a new app.
45295. You have a Power BI semantic model that contains a table named Table1. Table1 contains the following columns:
• WebsiteName
• URL
You need to create a report named Report1 that will contain a table visual. The solution must meet the following requirements:
• Display the website name.
• Enable users to navigate to the website's URL by selecting the website name.
What should you use?- Adata categories
- BConditional Formatting
- Cinline hierarchy labels
- DURL icons
46296. You use Power Query Editor to review a query that contains a column named Country.
You need to view the following information in the Data preview view for the Country column:
• The percentage of values that contain errors.
• The count of empty values.
What should you enable? To answer, select the appropriate options in the answer area.
NOTE: Each correct selection is worth one point.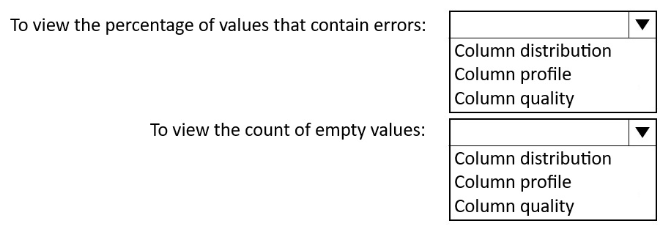
- AColumn quality
Column profile - BColumn profile
Column quality - CColumn distribution
Column profile
- AColumn quality
47297. You have a Power BI semantic model named Model1 that contains two fields named Sales and Quarter. Model1 contains a DAX measure that sums the Sales column.
You need to create a report that will contain the visual shown in the following exhibit
The solution must NOT require additional DAX measures.
Which type of visual should you use?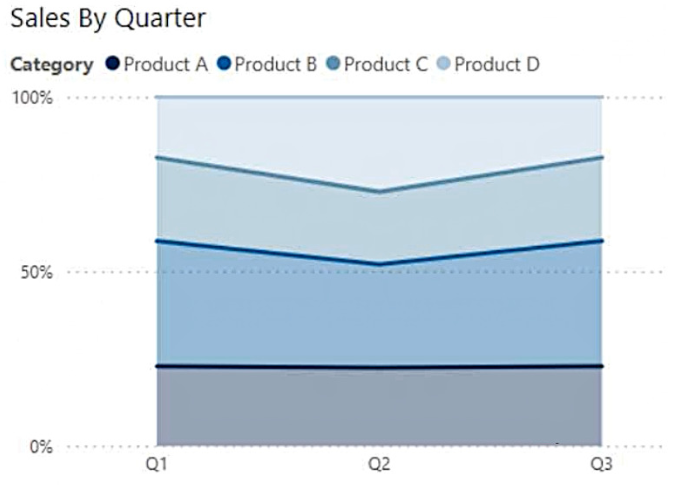
- Aribbon chart
- Bline chart
- C100% stacked area chart
- Darea chart
48298. You have a Power BI semantic model that contains a table.
You need to create a Power BI report page that contains two visuals that meet the following requirements:
• Visual 1: Displays the distribution of hierarchical data
• Visual 2: Search and then filter by values
Which type should you choose for each visual? To answer, drag the appropriate visual types to the correct visuals. Each visual type may be used once, more than once, or not at all. You may need to drag the split bar between panes or scroll to view content.
NOTE: Each correct selection is worth one point.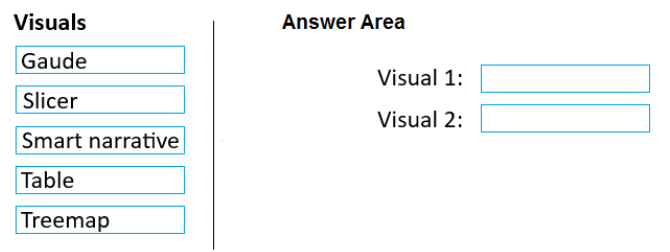
- Atreemap
slicer - Btable
treemap - Cgaude
slicer
- Atreemap
49299. You use Power Query Editor to review the query shown in the following exhibit.
Each Region value appears only on the row where it first occurred. Each subsequent occurrence of the Region value is blank.
You need to ensure that every row contains the correct non-blank value. The solution must minimize development effort.
Which column should you select, and which action should you perform on the column? To answer, select the appropriate options in the answer area.
NOTE: Each correct selection is worth one point.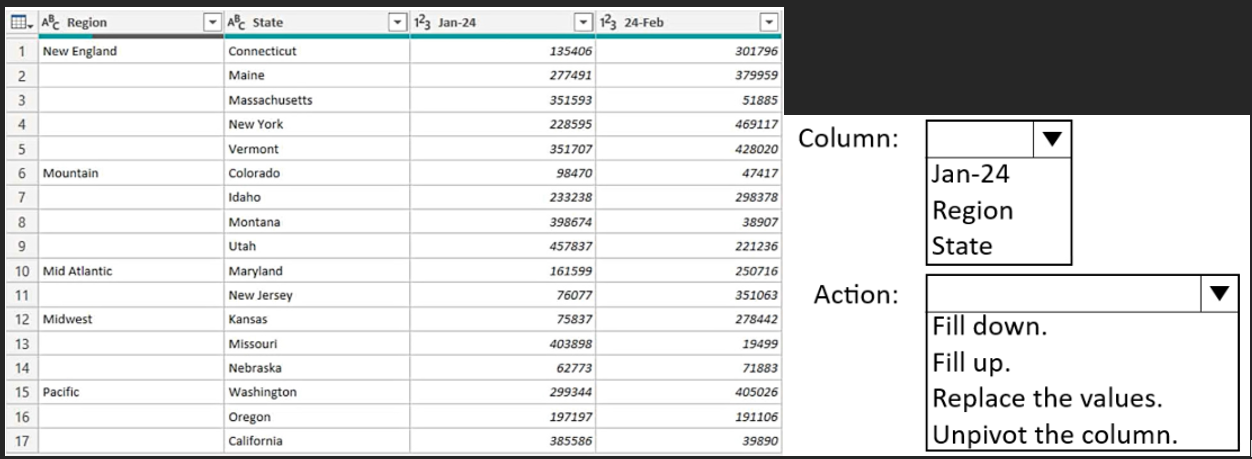
- Aregion
fill down - Bstate
fill down - Cregion
fill up
- Aregion
50300. You have a Power BI report that contains a bar chart. The bar chart displays sales by country.
You need to ensure that a summary of the data shown on the bar chart is accessible by using a screen reader.
What should you configure on the bar chart?- Aconditional formatting
- Balt text
- Cthe tab order
- Dthe layer order
Information
- Description
- Quiz on P251-300, created by Cristiana Ioana on 15/01/2026.
- Author
- Cristiana Ioana
- Language
- English
- Views
- 1
- Rating
- No ratings yet Rate this quiz