
Quiz
Econometric 4-5-6-7-8
Create a free account to finish this quiz
Save your progress and see your final score.
Already have an account? Sign in
Questions in this quiz (26)
1Binary variables
- Aare generally used to control for outliers in your sample.
- Bcan take on more than two values.
- Cexclude certain individuals from your sample.
- Dcan take on only two values.
2In the simple linear regression model, the regression slope
- Aindicates by how many percent Y increases, given a one percent increase in X.
- Bwhen multiplied with the explanatory variable will give you the predicted Y.
- Cindicates by how many units Y increases, given a one unit increase in X.
- Drepresents the elasticity of Y on X.
3In which of the following relationships does the intercept have a real-world interpretation?
- Athe relationship between the change in the unemployment rate and the growth rate of real GDP (“Okun’s Law”)
- Bthe demand for coffee and its price
- Ctest scores and class-size
- Dweight and height of individuals
4The OLS residuals, ˆi u , are sample counterparts of the population

- Aregression function slope
- Berrors
- Cregression function’s predicted values
- Dregression function intercept
5Changing the units of measurement, e.g. measuring test scores in 100s, will do all of the following EXCEPT for changing the
- Aresiduals
- Bnumerical value of the slope estimate
- Cinterpretation of the effect that a change in X has on the change in Y
- Dnumerical value of the intercept
6To decide whether the slope coefficient indicates a “large” effect of X on Y, you look at the
- Asize of the slope coefficient
- Bregression R2

- Ceconomic importance implied by the slope coefficient
- Dvalue of the intercept
7The t-statistic is calculated by dividing
- Athe OLS estimator by its standard error.
- Bthe slope by the standard deviation of the explanatory variable.
- Cthe estimator minus its hypothesized value by the standard error of the
estimator. - Dthe slope by 1.96.
8A binary variable is often called a
- Adummy variable
- Bdependent variable
- Cresidual
- Dpower of a test
9If the errors are heteroskedastic, then
- AOLS is BLUE
- BWLS is BLUE if the conditional variance of the errors is known up to a constant factor of proportionality
- CLAD is BLUE if the conditional variance of the errors is known up to a constant factor of proportionality
- DOLS is efficient
10Using the textbook example of 420 California school districts and the regression of test scores on the student-teacher ratio, you find that the standard error on the slope coefficient is 0.51 when using the heteroskedasticity robust formula, while it is 0.48 when employing the homoskedasticity only formula. When calculating the t-statistic, the recommended procedure is to
- Ause the homoskedasticity only formula because the t-statistic becomes larger
- Bfirst test for homoskedasticity of the errors and then make a decision
- Cuse the heteroskedasticity robust formula
- Dmake a decision depending on how much different the estimate of the slope is under the two procedures
11Using 143 observations, assume that you had estimated a simple regression function and that your estimate for the slope was 0.04, with a standard error of 0.01. You want to test whether or not the estimate is statistically significant. Which of the following decisions is the only correct one:
- Ayou decide that the coefficient is small and hence most likely is zero in the population
- Bthe slope is statistically significant since it is four standard errors away from zero
- Cthe response of Y given a change in X must be economically important since it is statistically significant
- Dsince the slope is very small, so must be the regression R2(square).
12In the multiple regression model, the adjusted R2, R2

- Acannot be negative.
- Bwill never be greater than the regression R2(square).
- Cequals the square of the correlation coefficient r.
- Dcannot decrease when an additional explanatory variable is added.
13If you had a two regressor regression model, then omitting one variable which is relevant
- Awill have no effect on the coefficient of the included variable if the correlation between the excluded and the included variable is negative.
- Bwill always bias the coefficient of the included variable upwards.
- Ccan result in a negative value for the coefficient of the included variable, even though the coefficient will have a significant positive effect on Y if the omitted variable were included.
- Dmakes the sum of the product between the included variable and the residuals different from 0.
14Under the least squares assumptions for the multiple regression problem (zero conditional mean for the error term, all Xi and Yi being i.i.d., all Xi and ui having finite fourth moments, no perfect multicollinearity), the OLS estimators for the slopes and intercept
- Ahave an exact normal distribution for n > 25.
- Bare BLUE.
- Chave a normal distribution in small samples as long as the errors are homoskedastic.
- Dare unbiased and consistent.
15The following OLS assumption is most likely violated by omitted variables bias:
- A
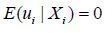
- B

- C

- Dthere is heteroskedasticity
- A
16The dummy variable trap is an example of
- Aimperfect multicollinearity
- Bsomething that is of theoretical interest only
- Cperfect multicollinearity
- Dsomething that does not happen to university or college students
17Imperfect multicollinearity
- Ais not relevant to the field of economics and business administration
- Bonly occurs in the study of finance
- Cmeans that the least squares estimator of the slope is biased
- Dmeans that two or more of the regressors are highly correlated
18Consider the multiple regression model with two regressors X1 and X2, where both variables are determinants of the dependent variable. You first regress Y on X1 only and find no relationship. However when regressing Y on X1 and X2, the slope coefficient 1ˆ changes by a large amount. This suggests that your first regression suffers from

- Aheteroskedasticity
- Bperfect multicollinearity
- Comitted variable bias
- Ddummy variable trap
19Imperfect multicollinearity
- Aimplies that it will be difficult to estimate precisely one or more of the partial effects using the data at hand
- Bviolates one of the four Least Squares assumptions in the multiple regression model
- Cmeans that you cannot estimate the effect of at least one of the Xs on Y
- Dsuggests that a standard spreadsheet program does not have enough power to estimate the
multiple regression model
20When testing joint hypothesis, you should
- Ause t-statistics for each hypothesis and reject the null hypothesis is all of the restrictions fail
- Buse the F-statistic and reject all the hypothesis if the statistic exceeds the critical value
- Cuse t-statistics for each hypothesis and reject the null hypothesis once the statistic exceeds the critical value for a single hypothesis
- Duse the F-statistics and reject at least one of the hypothesis if the statistic exceeds the critical value
21In the multiple regression model, the t-statistic for testing that the slope is significantly different from zero is calculated
- Aby dividing the estimate by its standard error.
- Bfrom the square root of the F-statistic.
- Cby multiplying the p-value by 1.96.
- Dusing the adjusted R2(square) and the confidence interval.
22If you wanted to test, using a 5% significance level, whether or not a specific slope coefficient is equal to one, then you should
- Asubtract 1 from the estimated coefficient, divide the difference by the standard error, and check if the resulting ratio is larger than 1.96.
- Badd and subtract 1.96 from the slope and check if that interval includes 1.
- Csee if the slope coefficient is between 0.95 and 1.05.
- Dcheck if the adjusted R2 is close to 1.
23When there are two coefficients, the resulting confidence sets are
- Arectangles
- Bellipses
- Csquares
- Dtrapezoids
24The homoskedasticity-only F-statistic and the heteroskedasticity-robust F-statistic typically are
- Athe same
- Bdifferent
- Crelated by a linear function
- Da multiple of each other (the heteroskedasticity-robust F-statistic is 1.96 times the homoskedasticity-only F-statistic)
25A nonlinear function
- Amakes little sense, because variables in the real world are related linearly.
- Bcan be adequately described by a straight line between the dependent variable and one of the explanatory variables.
- Cis a concept that only applies to the case of a single or two explanatory variables since you cannot draw a line in four dimensions.
- Dis a function with a slope that is not constant.
26The best way to interpret polynomial regressions is to
- Atake a derivative of Y with respect to the relevant X.
- Bplot the estimated regression function and to calculate the estimated effect on Y associated with a change in X for one or more values of X.
- Clook at the t-statistics for the relevant coefficients.
- Danalyze the standard error of estimated effect.
Information
- Description
- Econometric 4-5-6-7-8
- Author
- aykutwashere
- Language
- English
- Views
- 444
- Tags
- Rating
- No ratings yet Rate this quiz