
Quiz
Functions and Scatterplots
Create a free account to finish this quiz
Save your progress and see your final score.
Already have an account? Sign in
Questions in this quiz (17)
1Which of the following could be the graph of a function?
- A

- B

- C

- D

- A
2Which of the following ordered pairs, when graphed, would fail the Vertical Line Test for functions?
- A{(2,-3),(0,-1),(2,1),(4,3)}
- B{(-3,2),(-1,0),(1,2),(3,4)}
- C{(-15,0),(-7,4),(1,8),(9,12)}
- D{(0,-15),(4,-7),(8,1),(12,0)}
3A truck rental company charges a $50.00 fee for each day a truck is rented, plus $0.75 per mile the truck is driven. Which equation below would help you determine the cost of renting a truck for two weeks and 800 miles?
- Ay=2d+0.75m
- By=75d+.50m
- C50d=y+.75m
- Dy=50d+.75m
4Which equation is a representation of the table below?

- Ay=-3x+5
- By=-3x-5
- Cy=3x-5
- Dy=3x+5
5Which equation could be used to describe the data in the table below?

- Ay=3x+1
- By=2x+1
- Cy=x+3
- Dy=x+2
6Able Construction Company has been awarded a job to remodel the Lvingston's home. As the number of workers on the job increases, the number of hours to complete the remodeling decreases, and this in turn affects the overall cost. A graph representing this situation is shown. What does each axis represent?

- Ax-axis: hours, y-axis: workers
- Bx-axis: hours, y-axis: cost
- Cx-axis: cost, y-axis: workers
- Dx-axis: workers, y-axis: hours
7If f(x)=1/3x-4, what are f(-3) and f(12)?
- A0 and 3
- B3 and 8
- C-5 and 0
- D0 and 5
8The following table represents a linear function f(x). What is f(9)?

- A-34
- B54
- C56
- D14
9The population of Irving was 2,615 in 1950. The scatterplot below shows how the population has increased since 1950.
What is the best prediction of the population in the year 2010?
- A50,000
- B210,000
- C150,000
- D300,000
10This scatterplot shows what?

- Aa negative correlation
- Ba positive correlation
- Cno correlation
- Dnot enough information
11This scatterplot shows what?

- Aa negative correlation
- Ba positive correlation
- Cno correlation
- Dnot enough information
12This scatterplot shows what?

- Aa negative correlation
- Ba positive correlation
- Cno correlation
- Dnot enough information
13What is the slope of the line?

- A3/2
- B-3/2
- C2/3
- D-2/3
14Miss King created the scatterplot below to show the relationship of the test scores and the study time for 9 of her students. What conclusion does the scatterplot support?
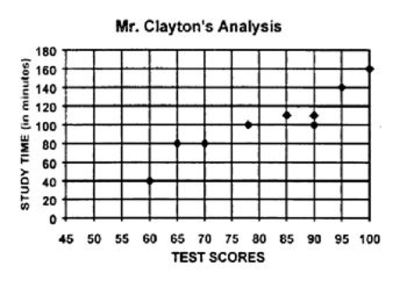
- AStudents with the least study time got the highest test scores
- BStudents in Miss King's clas always study for a test. (Ha!)
- CThe more time spent on studying the lower the test score.
- DThe more time spent on studying the higher the test score.
15The scatterplot shows the comparison of errors made on a final exam to the number of hours spent studying. Based on this scatterplot, what observations could be made about studying?

- AMore time spent studying means more mistakes.
- BLess time spent studying means less mistakes.
- CMore time spent studying means less mistakes.
- DThe amount of time spent studying has no effect on the number.
16Which statement is true about the relation shown on the graph below?

- AIt is a function because there exists one x-coordinate for each y-coordinate.
- BIt is a function because there exists one y-coordinate for each x-coordinate.
- CIt is not a function because there are multiple y-values for a given x-value.
- DIt is not a function because there are multiple x-values for a given y-value.
17Your next benchmark is on what day?
- AJanuary 1st, 2014
- BDecember 25th 2013
- CAugust 1st, 2014
- DJanuary 29th, 2014
Information
- Description
- 8.F.1-4, 8.SP.1-3
- Author
- bking
- Language
- English
- Views
- 15
- Rating
- No ratings yet Rate this quiz