
Quiz
mathematics
This quiz has a time limit, so it opens in the usual player.
Questions in this quiz (15)
1The histograms and pie charts are classified as one dimensional diagrams because only
- Alength is considered
- Bwidth is considered
- Clength plus width is considered
- Dbreadth is considered
2The types of histograms includes
- Adeviation bar charts
- Bpaired bar charts
- Cgrouped charts
- Dall of above
3The histograms, pie charts and frequency polygons are all types of
- Aone dimension diagrams
- Btwo dimension diagrams
- Ccumulative diagrams
- Ddispersion diagrams
4The relative measures in measures of dispersion are also considered as
- Acoefficient of deviation
- Bcoefficient of average
- Ccoefficient of variation
- Dcoefficient of uniformity
5 If total sum of square is 20 and the sample variance is 5 then total number of observations are
- A15
- B25
- C4
- D35
6The formula in which Σ(x-x‾)2 is divided by one less than number of observations in sample is classified as
- Acoefficient of deviation
- Bmean variance
- Csample variance
- Dpopulation variance
7What is the purpose of a summary table?
- AThis is the only way to present categorical data in numerical form.
- BTo list data to create a bar or pie chart.
- CTo see differences between or among categories.
- DTo sum the values of responses to a survey.
8A graphical representation of a frequency distribution is called a__________________ .
- Atime-series plot
- Bhistogram
- Cstem-and-leaf plot
- Dscatter diagram
9You have a summary table and a simple bar chart (like the ones at the beginning of the chapter) indicating where customers prefer to do their banking. How could you enhance the bar chart to provide both visual and actual information?
- AThe bar chart and summary table must be presented together in order to represent this data.
- BOnly the summary table can show the actual values for the data.
- CUse vertical lines on the bar chart to show the values more precisely.
- DAdd values to the bar chart like what is commonly done on a pie chart.
10The width of a class interval in a frequency distribution (or bar chart) will be approximately equal to the range of the data divided by the number of [blank_start]class intervals[blank_end]
- Aclass intervals
11Which of the above histograms represents the graph of city restaurant meal prices with an interval of $8?
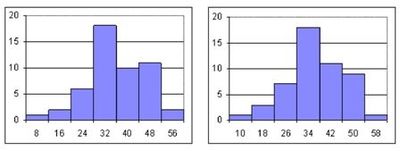
- ABoth histograms
- BOnly the histogram on the right
- CNeither histogram
- DOnly the histogram on the left
12When constructing a frequency distribution, which of the following rules must be followed?
- AThe width of each class is equal to the lowest value in the data set.
- BAdjacent classes cannot overlap.
- CThe midpoint of each class must be an integer.
- DThe number of classes must be an even number
13The rule of thumb for creating a frequency distribution is to divide the data into 5-15 classes. While larger numbers of classes allow for larger data sets, how do you know exactly how many classes to use?
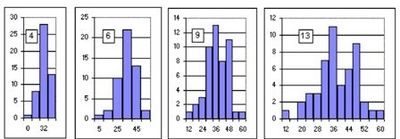
- ADetermine the width of the class interval, then calculate the number of classes.
- BSelect the number of classes that provides definition to the shape of the data.
- CAny number of classes between 5 and 15 is sufficient.
- DIf in doubt about the number of classes, select 10 since it is the midpoint between 5 and 15 classes.
14Considering the various types of tables and charts introduced in this chapter, which table, chart, diagram or plot would you use to depict categorical data for two variables in a visual format?
- Apie chart
- Bscatter plot
- Cside-by-side bar chart
- Dcontingency table
15Which of the following would be most helpful in the construction of a pie chart?
- Acumulative percentages
- Brelative frequencies
- Cogive
- Dfrequency distribution
Information
- Description
- Quiz on mathematics, created by jince.j on 05/02/2016.
- Author
- jince.j
- Language
- English
- Views
- 4
- Rating
- No ratings yet Rate this quiz