
Quiz
Research methods practice
Create a free account to finish this quiz
Save your progress and see your final score.
Already have an account? Sign in
Questions in this quiz (62)
1If two variables are totally independent, then the correlation between them is:
- A-0.1
- B-1.00
- C+1.00
- Dzero
2If 36% of the variation in scores on y has been accounted for by scores on x, how much variance is unexplained?
- A64%
- B36%
- C6%
- D0.6%
3A correlation coefficient of +0.40 could be considered:
- Amoderate.
- Bweak.
- Czero.
- Dstrong.
4A correlation of +.80 has been found between impulsivity and number of offences committed in a group of young men. How much variance in impulsivity can be explained by number of offences committed in percentage terms?
- A64%
- B18%
- C36%
- D20%
5A researcher is examining the relationship between depression and adult attachment. However he has reason to believe that childhood attachment influences both of these. He decides to calculate some partial correlations. Which of the following, if any, should he do?
- AExamine the relationship between depression and adult attachment controlling for childhood attachment.
- BExamine the relationship between childhood attachment and adult attachment controlling for depression.
- CExamine the relationship between depression and childhood attachment controlling for adult attachment.
- DNone of the above are possible.
6Consider the following information. What might you conclude?
n = 26
r = 0.85
x = being in care
y = feeling different from others- AThere is a moderate negative relationship between being in care and feeling different from others.
- BBeing in care had an effect on people to make them feel different from others.
- CThere is a strong positive relationship between being in care and feeling different from others.
- DThere is no association between being in care and feeling different from others.
7which of the following constitute continuous variables?
- Agender
- Btemperature
- Cnumber of times a score of 180 is achieved in a darts match.
- Dall of the above.
8In analysis of variance, the term factor refers to ____.
- Aa dependent variable
- Ban independent (or quasi-independent) variable
- Ca treatment mean
- Da treatment total
9When the null hypothesis is true for an ANOVA, what is the expected value for the F-ratio?
- A0
- B1.00
- Ck-1
- Dn-k
10
For an experiment comparing more than two treatment conditions you should use analysis of variance rather than separate t tests because ____.- Aa test based on variances is more sensitive than a test based on means
- Byou are less likely to make a mistake in the computations of ANOVA
- CANOVA has less risk of a Type I Error because several means are compared in one test
- DANOVA has less risk of a Type II Error because several means are compared in one test
11In analysis of variance, the F-ratio is a ratio of
- Avariances
- Bsample means
- Csample means divided by variances
- Dsample variances divided by sample means
12The F-ratio is a result of
- Awithin-groups variance/between-groups variance
- Bbetween-groups variance/within-groups variance
- Cbetween-groups variance x within-groups variance
- Dbetween-groups variance + within-groups variance
13The relationship between the F ratio and the t-value is explained by
- At^2= F
- BF^2= t
- Ct^3= F
- Df^3= t
14Professor Nut is examining the differences between the scores of three groups. If the groups show homogeneity of variance, this means that the variances for the groups:
- AAre similar
- BAre dissimilar
- CAre exactly the same
- DAre enormously different
15Differences between groups, which result from our experimental manipulation, are called:
- AIndividual differences
- BTreatment effects
- CExperiment error
- Dwithin-participants effects
16Individual differences within each group of participants are called:
- ATreatment effects
- Bbetween-participants error
- Cwithin-participants error
- DIndividual biases
17Below are the results of a one-way, between groups analysis of variance (ANOVA). Use this output to answer the question:
Which of the following statistical statements best describes the result of the analysis: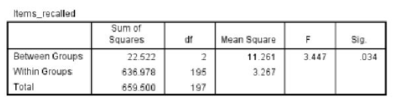
- AF(2,197) = 3.45, p = .034
- BF(2,197) = 3.45, p = 0.034
- CF(2,195) = 3.45, p = 0.034
- DF(2,195) = 3.45, p = .034
18
The Pearson correlation measures _____.- Athe degree of curvilinear relationship
- Bthe degree to which the relationship is consistently one directional
- Cthe degree of linear relationship
- Dthe degree of relationship without regard to the form of the relationship
19A scatter plot shows a set of data points that are widely scattered around a line that slopes down to the right. Which of the following values would be closest to the correlation for these data?
- A-0.40
- B0.40
- C0.80
- D-0.80
20The narrower the confidence intervals
- Athe more confidence you can place in your results
- Bthe less you can rely on your results
- Cthe greater the chance that your results were due to sampling error
- Dnone of the above
21A power level of 0.3 means:
- Ayou have a 30% chance of detecting an effect
- Byou have a 49% chance of detecting an effect
- Cyou have a 70% chance of detecting an effect
- Dyou have a 0.7% chance of detecting an effect
22Effect size is:
- AThe magnitude of the difference between conditions
- Bthe strength of a relationship or association
- CBoth of these
- Dneither of these
23A researcher found a correlation coefficient of r= =+0.30, CI(95%) = -0.2-(+0.7). Which is the most sensible conclusion? We are 95% confident that the population regression line would be:
- APositive (+0.30)
- BZero
- CNegative (-0.2)
- DBetween -0.2 and +0.7
24It is important to know the power of a study when:
- AThe study has large participants numbers and is statistically significant
- BThe study has large participant numbers and is not statistically significant
- CThe study has small participant numbers and is not statistically significant
- DThe study has small participants numbers and is statistically significant
25Confidence intervals around a mean value give you:
- AA range within which the population mean is likely to fall
- BA range within which the sample mean is likely to fall
- CA point estimate of the sample mean
- DA point estimate of the population mean
26If d= 0.89, the the effect size is said to be:
- Azero
- Bweak
- Cmoderate
- Dstrong
27The DF for an independent t-test analysis with 20 participants in each condition is:
- A38
- B20
- C40
- D68
28A Pearson correlation of r = +1.00 between X and Y indicates _____.
- Aevery change in X causes a change in Y
- BAll of the other 3 choices occur with a correlation of +1.00.
- Ceach time X increases, there is a perfectly predictable increase in Y
- Devery increase in X causes an increase in Y
29Which of the following sets of correlations correctly shows the highest to lowest degree of relationship?
- A-0.91, +0.83, +0.10, -0.03
- B+0.83, +0.10, -0.03, -0.91
- C-0.91, +0.83, -0.03, -0.10
- D+0.83, +0.10, -0.91, -0.03
30
The Pearson correlation is calculated for a sample of n = 25 individuals. What value of df should be used to determine whether or not the correlation is significant?- A25
- B23
- C24
- Dcannot be determined without additional information
31The results of a correlation analysis are as follows: r(72) = .56, p = .046. Calculate the coefficient of determination (R2):
- A.44
- B.31
- C.046
- D.56
32
A researcher decides to run a correlation to discover whether a positive relationship exists between variable X and variable Y. He should conduct a _____- A1 tailed test
- BType II test
- CType I test
- D2 tailed test
33A researcher conducts an experiment and discovers a significant (p < .05) difference between her two experimental groups. What is the next step she should take?
- AAccept the alternate hypothesis
- BFail to accept the alternate hypothesis
- CReject the null hypothesis
- DFail to reject the null hypothesis
34The higher the t value, the more likely it is that the differences between groups are:
- AA result of sampling error
- BNot a result of sampling error
- Csimilar to each other
- DNone of the answers
35For an independent t-test with 15 participants in each condition, the appropriate DF is:
- A28
- B14
- C30
- D15
36Length of time working at a computer and poor eyesight are negatively correlated. What should we conclude?
- Apeople with poor eyesight are more likely to spend long hours working at a computer
- Bworking for long hours is likely to cause a deterioration in eyesight
- CA particular type of personality may be more likely both to have poor eyesight and to work long hours at a computer
- DAny of the above are possible- Correlation does not imply causation
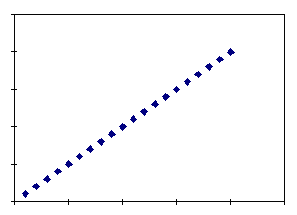
37which is the most sensible answer? The variables show a correlation of:
- A-1.0
- B-0.1
- C+1.00
- D+0.1
38Which of the following is the most appropriate description of a Type I error?
- AReject the null hypothesis when it is true
- BFail to reject the null hypothesis when it is false
- CReject the null hypothesis when it is false
- DFail to reject the null hypothesis when it is true
39Which of the following is the most appropriate description of a Type II error?
- AReject the null hypothesis when it is true
- BFail to reject the null hypothesis when it is true
- CFail to reject the null hypothesis when it is false
- DReject the null hypothesis when it is false
40
The p value is a conditional probability, and represents ________.- AThe probability of finding the effect if the null hypothesis was true
- BThe probability of finding the effect if the null hypothesis was false
- CThe probability of not finding the effect if the null hypothesis was true
41When we convert a score into a score from a probability distribution, it becomes a _______.
- AProbability
- BTest score
- CTest statistic
- DSignificance value
42what are the scores in the standard normal distribution?
- AExtreme scores
- Bz-scores
- Cstandard deviation scores
- Dboth the second and third answer
43If you had a Z score of 2.33, this would tell you that:
- AYour score was 2.33 standard deviations above the mean
- BYour score was 2.33 standard deviations below the mean
- CThere was a probability of 2.33 obtaining a score greater than your score
- DThere was a probability of 2.33 obtaining a score less than your score
44if an event has a probability of 95% of occurring, what does this mean?
- AThe event is likely to occur 5 times out of every 100
- BThe event is likely to occur 95 times out of every 100
- CThe event is likely to occur 95 times out of every 95
- Dnone of the answers.
45In N = 25 games last season, the college basketball team averaged μ = 74 points with a standarddeviation of σ = 6. In their final game of the season, the team scored 90 points. Based on thisinformation, the number of points scored in the final game was ____.
- Aa little above average
- Bfar above average
- Cabove average, but impossible to tell by how much
- DThere is not enough information to compare last year with the average.
46which of these could you not generate confidence intervals for?
- AA mean
- BA correlation coefficient
- Cthe mean difference between scores
- Dnone of the above
47Given a standard error of 5.2 with a sample size of 9, what is the standard deviation?
- A1.73
- B15.6
- C46.8
- D0.556
48if you draw 100 samples from a population and plot all their means as a frequency histogram, then you have:
- AMean distrubution
- Bskewed distrubution
- Csampling distribution
- Dnone of the above
49which of the following measures of central tendency are sensitive to extreme scores?
- Amode
- Bmedian
- Cmean
- Dnone of them.
50a perfectly normal distribution:
- Ais bell shaped, symmetrical and has tails that approach the x axis at infinity
- Bis only applicable for normal people
- Chas equal mean, median and modes
- Dthe first and third answer
51the wilcoxon test is appropriate for:
- AWithin- particpants design
- BBetween-participants design
- CMatched-participants design
- DBoth one and three
52To assess the difference in scores from two conditions of a between-participants design, with ranked data, you would use:
- AThe independent t-test
- BThe wilcoxon
- Cthe related t-test
- DMann-Whitney
53The DF for an independant t test analysis with 20 participants in each condition is:
- A38
- B20
- C40
- D68
54For a paired t-test with 40 participants, the appropriate DF is:
- A20
- B39
- C38
- DNone of these
55For an indépendant t-test with 15 participants in each condition, the DF is:
- A28
- B14
- C30
- D15
56One hundred students were tested on their anxiety before and after an anxiety counselling session, Scored are drawn from a normally distributed population. Which statistical test is the most appropriate?
- AIndependant Groups t-test
- BRelated measures t-test
- CLevenes Test
- DNone of these
57The most important assumption to Meet when using a t-test is
- AThe variation in scores should be a minimal
- BScores should be drawn from a normally distributed population
- CConditions should have equal means
- Dall of the above
58Which of the following is NOT an example of predictive validity?
- AA questionnaire measure of enjoyment of social interactions correlates
negatively with clinician-rated symptoms of social-anxiety. - BPeople who take more risks on a task designed to measure impulsive risk-
taking also use illegal substances more often. - CPeople’s scores on two different self-report measures of depression are
similar across multiple time points. - DA questionnaire measure of schizophrenia symptoms distinguishes
between people diagnosed with schizophrenia and people diagnosed
with bipolar disorder.
- AA questionnaire measure of enjoyment of social interactions correlates
59A matched pairs design refers to which of the following:
- AAll participants receive all levels of each condition.
- BData is collected from two individuals that has been matched based on
their score for the dependant variable. - CData is collected from one individual but it is collected across two time-
points. - DData is collected from two individuals, but matched on variables that are
important for the study.
60Which of the following is incorrect when considering Thematic Analysis?
- AThe top down approach starts with a theme in mind, and the data is
organised accordingly. - BThe bottom up approach works from the data up, allowing themes to
emerge. - CA hybrid of top-down and bottom up approaches are commonly used.
- DNone of the above.
- AThe top down approach starts with a theme in mind, and the data is
61A researcher was interested in stress levels of lecturers during lectures. She took the same group of 8 lecturers and measured their anxiety (out of 15) during a normal lecture and again in a lecture in which she had paid students to be disruptive and misbehave. The data were not normally distributed. Which test should she use to compare her experimental conditions?
- APaired samples t test
- BMann-Whitney test
- CWilcoxon signed-rank test
- DWilcoxon rank sum test
62A researcher measured the same group of people’s physiological reactions while watching horror films and compared them to when watching erotic films. The resulting data were skewed. What test should be used to analyse the data?
- AIndependent t-test
- Bwilcoxon signed rank test
- Cdependent t test
- Dmann-whitney
Information
- Description
- Quiz on Research methods practice, created by Hannah Lambert on 15/05/2016.
- Author
- Hannah Lambert
- Language
- English
- Views
- 0
- History
- Created on 15 May 2016 · updated on 18 Jan 2017
- Rating
- No ratings yet Rate this quiz