7315161
Description
Quiz by Jessica Whittick, updated more than 1 year ago
|
|
Created by Jessica Whittick
over 7 years ago
|
|
Question 1
Question
What is the purpose of performing a linear regression analysis?
Answer
-
To identify potential outliers in the data
-
To fit the data to a model that defines y as a function or 2 or more variables
-
To determine the dependence of a dependent variable on a predictor/independent variable
-
To perform multiple comparisons whilst controlling overall type 1 error rate
-
To derive robust confidence intervals
Question 2
Question
Which axis does the dependent variable go on?
Answer
-
y
-
x
Question 3
Question
What does the mean of the x and y values give you in a linear regression analysis?
Answer
-
The size of the force which the points exert on the line of best fit
-
The leverage of those data points
-
The fit and slope of the model
-
The centre of gravity and pivot point of the data
Question 4
Question
What does the R-squared value represent?
Answer
-
How well the model fits the data (0 - 1)
-
The slope coefficient
-
The distribution of the residuals
-
The level of multicolinearity in the model
Question 5
Question
What does an R-squared value of 0.068 and a slope coefficient (b1) value of 0.12 mean?
Answer
-
The model can explain 68% of the data and for every unit of independent variable, the dependent variable goes up 12 units
-
The fit of the model to the data is 0.12% and the influence that the data points have on the model is 0.68%
-
The data points have an influence of 68% on the model and 12% on the outcome
-
The model can explain 6.8% of the data and for every unit of independent variable, the dependent variable goes up 0.12 units
Question 6
Question
In order to identify potential outliers:
Answer
-
Standardised residual >2 is worth checking, if more than 5% of the residuals >2 may indicate model is a poor fit
-
Standardised residual >3 is worth checking, if more than 5% of the residuals >2 may indicate that the model is a poor fit
-
Standardised residual >2.5 is worth checking, if more than 5% of the residuals >2 may indicate that the model is a poor fit
-
Standardised residual >3 is worth checking, if more than 10% of the residuals >2 may indicate that the model is a poor fit
Question 7
Question
What does Cook's distance tell us when performing model diagnostics to see if the regression model is stable or biased by a few cases?
Answer
-
influence of data point on predicted values (0 = no influence, 1 = complete influence)
-
standardised measures of how much each element of the model would change if data point was removed (values >1 = substantial influence)
-
how susceptible the mean is to being biased by the outliers present in the data
-
measure of overall influence of each individual data point on the overall model (>1 = concern)
Question 8
Question
What does the Leverage value tell us when performing model diagnostics to see if the regression model is stable or biased by a few cases?
Answer
-
influence of data point on predicted values (0 = no influence, 1 = complete influence)
-
standardised measures of how much each element of the model would change if data point was removed (values > 1 = substantial influence)
-
measure of overall influence of each individual data point on the overall model (> 1 = concern)
-
precisely how large the standardised residuals are
Question 9
Question
With regard to model diagnostics, what do the DFFit and DFBeta values tell us about the data model?
Answer
-
they are standardised measures of how much each element of the model would change if that data point was removed (values > 1 = substantial influence)
-
they indicate the influence of that data point on predicted values (0 = no influence, 1 = complete influence)
-
whether or not the standardised residuals are worth checking and if they indicate that the model is a poor fit
-
they summarise the equation: 2(k+1)/n where k = number of predictors and n = number of data points
Question 10
Question
With regard to the model diagnostic called the Leverage value, what defines whether or not the data point is worth investigating?
Answer
-
if >2(k+1)/n where k = number of predictors (2 for simple linear regression) and n = number of data points
-
if >2(k+1)/n where k = number of predictors (1 for simple linear regression) and n = number of data points
-
if >2(K+1)/n where k = number of data points and n = number of predictors (1 for simple linear regression)
-
if >n(k+1)/2 where k = number of predictors (1 for simple linear regression) and n = number of data points
-
if >2(n+1)/k where k = number of predictors (1 for simple linear regression) and n = number of data points
Question 11
Question
Multiple linear regression does what?
Answer
-
fits the data to a model that defines y as a function of 2 or more variables - determines the effect of an independent variable on the dependent variable taking account of other variables
-
provides an analysis of variance and determines if an interaction is present in the data
-
determines the dependence of a dependent variable on a predictor/independent variable and allows outliers to be identified from x, y plot or from standardised residual plot
Question 12
Question
With regard to multiple linear regression, what is the correct form of the equation for the model which is fitted? (all of the numbers are technically subscript)
Answer
-
y = b0 + b1x2 + b2x1
-
y = b0 + b1x1 + b2x2 +....
-
y = b0 + b1 + b2x
-
y = b0 + b1x1 + b2x2
Question 13
Question
What does the F-ratio represent?
Answer
-
the average variability due to the model divided by the average variability due to the residuals
-
the unexplained variability divided by the variability due to the model
-
the signal to noise ratio multiplied by the number of data points
-
the variance in the model divided by the R-squared value
Question 14
Question
With regard to multiple linear regression, whenever you fit a predictor variable, that takes up...
Answer
-
one slope parameter
-
two degrees of freedom
-
one degree of freedom
-
one R-squared value
Question 15
Question
As colinearity increases what effect does this have?
Answer
-
standard errors of b coefficients decrease therefore confidence increases
-
limits F-ratio value and variance inflation factor
-
coefficients become stable
-
standard errors of b coefficients increase and therefore confidence decreases
Question 16
Question
How do you interpret the variance inflation factor (VIF) when assessing multicolinearity?
Answer
-
A VIF > 5 or an avereage VIF > 2 is problematic
-
A VIF > 10 or an average VIF > 1 is problematic
-
A VIF > 2 or an average VIF > 1 is problematic
-
A VIF > 10 or an average VIF > 2 is problematic
Question 17
Question
How do you interpret the tolerance factor when assessing multicolinearity?
Answer
-
< 5 is problematic
-
< 10 is problematic
-
< 2 is problematic
-
< 0.1 is problematic
-
< 1 is problematic
Question 18
Question
When does multicolinearity truly pose a problem?
Answer
-
when predicting y using the multiple regression equation
-
when you want to look inside the model at the effect of individual predictors
-
when you want to perform separate correlations for each x variable
-
when you want to quantify the relationship between an independent and dependent variable
Question 19
Question
How do you help solve the problem of multicolinearity?
Answer
-
always take a colinear variable out
-
combine predictors into a single predictor (as long as it makes biological sense)
-
rely on automatic variable selection
-
remove all outliers
Question 20
Question
With regard to hierarchical multiple regression, what value do you use when comparing new model to previous model?
Answer
-
F-ratio
-
Cook's distance
-
R-squared
-
variance inflation factor
-
tolerance factor
Question 21
Question
For multiple linear regression assumptions, what must the variables be?
Answer
-
dependent variables = quantitative or categorical predictor variable = qualitative and continuous
-
dependent variables = qualitative predictor variable = continuous
-
dependent variables = qualitative and continuous predictor variable = quantitative or categorical
-
dependent variables = continuous or categorical predictor variable = quantitative or categorical
Question 22
Question
When considering multiple linear regression assumptions, how do you assess the independence of the residuals?
Answer
-
assess the DFFit and DFBeta values
-
use the Welch's test
-
use Gabriel's test
-
use the Durbin-Watson test
Question 23
Question
For multiple linear regression, how large should the sample size be?
Answer
-
10 times the number of predictors tested
-
5 times the number of predictors tested
-
at least 30
-
at least 40
Question 24
Question
What would an interaction among predictors look like in the form of an equation?
Answer
-
effect of height + effect of weight = overall effect on SBP
-
effect of height + overall effect on SBP = effect of weight
-
effect of height x effect of weight = overall effect on SBP
Question 25
Question
What is simple linear regression equal to?
Answer
-
paired t-test
-
unpaired t-test
-
unpaired, two-tailed t-test
-
paired, one-tailed t-test
Question 26
Question
A one-way anova is the same as what?
Answer
-
unpaired t-test
-
paired t-test
-
simple linear regression
-
multiple regression
Question 27
Question
What does a one-way ANOVA do?
Answer
-
analyses how much of the overall variance can be explained by variation between group means compared to the unexplained variation within a group
-
fits data to a model that defines y as a function of 2 or more variables
-
performs separate correlations for each x variable
-
determines the dependence of a dependent variable on a predictor/independent variable
Question 28
Question
What does the total variability equal?
Answer
-
total squares divided by the degrees of freedom
-
the F-ratio
-
the difference between each individual data point and the overall mean
-
error mean squares divided by degrees of freedom
Question 29
Question
The F-ratio is:
Answer
-
higher the larger the difference of the group means from the overall mean and smaller the amount of random variability
-
lower the larger the difference of the group means from the overall mean and smaller the amount of random variability
-
higher the larger the difference of the group means from the overall mean and larger the amount of random variability
-
higher the smaller the difference of the group means from the overall mean and smaller the amount of random variability
Question 30
Question
When is the ANOVA most robust to deviations from normality and equality of variance?
Answer
-
when effect size is large
-
when the F-ratio is high
-
when the degrees of freedom are greater than 10
-
when the group sizes are equal
Question 31
Question
If group sizes are unequal and equality of variance is not met then which correction do you use?
Answer
-
Games-Howell's
-
Durbin-Watson's
-
Gabriel's
-
Tukey's
-
Welch's
Question 32
Question
What are post-hoc tests used for?
Answer
-
performing multiple comparisons whilst controlling overall type 2 error rate
-
performing multiple comparisons whilst controlling overall type 1 error rate
-
when there is a specific hypothesis to be tested
-
when group size is not equal
Question 33
Question
You use Tukey's test when which of the following is true? (multiple correct answers)
Answer
-
sample sizes are unequal
-
sample sizes are equal
-
you require good trade-off between type 1 and type 2 errors
-
you are interested in comparing all groups vs a single control group
-
you wish to cut down on the number of comparisons that you make
Question 34
Question
When would you use Bonferroni as a post-hoc test? (multiple correct answers)
Answer
-
when you don't need a high level of confidence
-
when you aren't performing multiple comparisons
-
when you require a conservative test
-
when you need a high level of confidence
-
when sample sizes are equal
Question 35
Question
When would you use Dunnet's as a post-hoc test? (multiple correct answers)
Answer
-
when interested in comparing all groups versus a single control group
-
when sample sizes are equal
-
when you want to cut down comparisons
-
when you want a good trade-off between type 1 and type 2 errors
Question 36
Question
Separate, unpaired t-tests to do comparisons will increase your chance of getting what?
Answer
-
a false -ve
-
a type 2 error
-
a false +ve
-
biased data
Question 37
Question
If you have a sample which has an n number of 10 and a sample with an n number of 12, which post hoc test should you use?
Answer
-
Gabriel's
-
Hochberg's GT2
-
Games-Howell
-
Tukey
Question 38
Question
If there is any doubt about equality of variance then which post-hoc test should you use?
Answer
-
Gabriel's
-
Hochberg's GT2
-
Games-Howell
-
Sidak
Question 39
Question
Complete this statement relating to planned contrasts:
Always _________________________ than number of groups
Answer
-
ten times the number of contrasts
-
more contrasts
-
one more contrast
-
two times the number of contrasts
-
one fewer contrast
Question 40
Question
When doing orthogonal contrasts, the contrasts are independent so you can... (multiple correct answers)
Answer
-
enter weights for most of the variables
-
trust p-values as you aren't inflating the type 1 error rate
-
ignore the F-ratio value and R-squared value
-
not worry about doing any corrections for multiple comparisons
Question 41
Question
"tests for trends in the data, which cannot be obtained directly using post-hoc tests, when there is a logical order to the groups entered"
To what is this statement referring to?
Answer
-
Planned contrasts
-
Orthogonal contrasts
-
Polynomial contrasts
Question 42
Question
An independent factorial ANOVA does what?
Answer
-
each level of one factor is tested against at least one level of the other
-
performs multiple comparisons whilst controlling overall type 1 error rate
-
divides total variability in the data set into different sources
-
each level of one factor is tested at each level of the other
Question 43
Question
Sidak is the best correction for what?
Answer
-
independent ANOVA
-
one-way ANOVA
-
repeated measures ANOVA
-
multiple linear regression
Question 44
Question
Standard contrasts and post hoc tests are only available to examine main effects and are therefore most useful when:
Answer
-
there is no unnecessary variability in the data
-
there is no interaction
-
the sphericity assumption is met
-
group sizes are equal
Question 45
Question
A p value of less than 0.5 means that....
Answer
-
there is a less than 0.5% chance of committing a type 1error
-
there is a less than 5% chance of committing a type 2 error
-
there is a less than 5% chance of committing a type 1 error
-
there is a less than 0.5% chance of committing a type 2 error
Question 46
Question
Standard error the proportion equals....
Answer
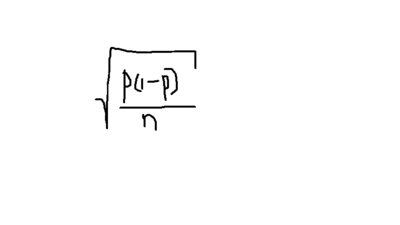
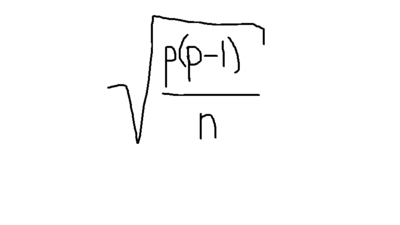
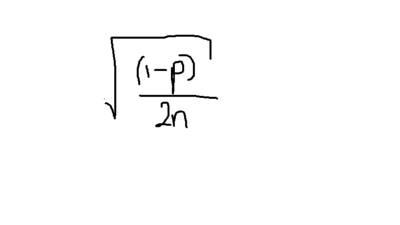
Question 47
Question
Power =
Answer
-
1 - type 1 error rate
-
1 - type 2 error rate
-
1 - (type 1 + type 2 error rate)
-
type 2 error rate - type 1 error rate
Question 48
Question
Power can be increased by....
Answer
-
increasing effect size. decreasing random variation. decreasing sample size.
-
increasing effect size. increasing random variation. increasing sample size
-
decreasing effect size. increasing random variation. increasing sample size
-
increasing effect size. decreasing random variation. increasing sample size
Question 49
Question
This gives you a standardised effect size for a difference between means, what is it called?
Answer
-
Welch's correction
-
Cohen's d
-
Games-Howell test
-
Sidak correction
-
standard error of the proportion
Question 50
Question
how do you calculate expected frequency?
Answer
-
(row total + column total)/overall total
-
(row total - column total)/overall total
-
(row total x column total)/overall total
Question 51
Question
How do you calculate degrees of freedom from a contingency table?
Answer
-
df = (rows - 1) x (columns -1)
-
df = (rows + 1) x (columns +1)
-
df = (rows - 1) / (columns -1)
-
df = (rows x 2) + (columns x 2)
Question 52
Question
With regard to categorical data - what must be satisfied in order for the analysis to be reliable?
Answer
-
The assumption that at least 50% of expected frequency must be more than or equal to 5
-
Dunnet's test
-
The assumption that at least 80% of expected frequency must be more than or equal to 5
-
The same assumptions as multiple linear regression
Question 53
Question
Which graph indicates an interaction?
Answer
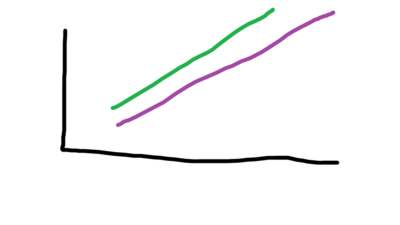
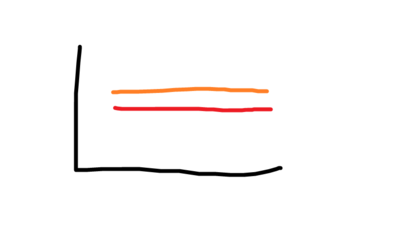
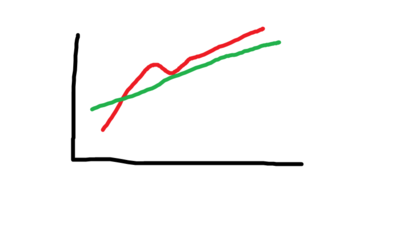
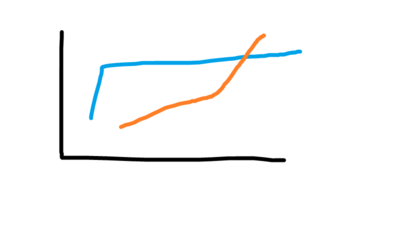
Question 54
Question
What does simple effects analysis do? (multiple correct answers)
Answer
-
probes where a certain effect is happening
-
performs an ANOVA to allow you to reject/accept a null hypothesis
-
analyses the differences between levels of one variable
-
performs multiple comparisons whilst controlling overall type 2 error rate
Question 55
Question
Which multiple comparison correction should you choose after simple effects analysis in order to control the overall type 1 error rate?
Answer
-
Bonferroni
-
LSD
-
Sidak
Question 56
Question
Repeated measures ANOVA requires the data to have/be:
Answer
-
independent
-
not independent
-
naturally paired
-
sorted into even group sizes
Question 57
Question
What is the definition of sphericity?
Answer
-
“noise” in the relationship between the independent variables and the dependent variable is the same across all values of the independent variables
-
equality of differences between linked values in each group
-
well-modeled by a normal distribution and likely for a random variable underlying the data set to be normally distributed
-
residuals are (roughly) normal and (approximately) independently distributed with a mean of 0 and some constant variance
Question 58
Question
Which test provides a fix for sphericity?
Answer
-
Welch's correction
-
Games-Howell test
-
Gabriel's test
-
Mauchy's test
Question 59
Question
How can we adjust the degrees of freedom and change the significance level associated with the F-statistic?
Answer
-
Mauchy's test
-
Welch's correction
-
Green House-Geisser correction
-
Gabriel's test
Question 60
Question
Which post hoc test is most robust and most conservative for a repeated measures ANOVA?
Answer
-
Sidak
-
Tukey
-
Dunnets
-
Bonferroni
Question 61
Question
If parametric assumptions are in doubt, we must use the non-parametric equivalent of a single factor repeated measures ANOVA which is:
Answer
-
Durbin-Watson test
-
Friedman test
-
Gabriel's test
-
Hochberg's GT2 test
Question 62
Question
For which analysis do BOTH the equality of variance assumption and sphericity assumption apply?
Answer
-
Non-linear regression
-
Two-way ANOVA
-
Independent ANOVA
-
Mixed model ANOVA
-
Repeated measures ANOVA
Question 63
Question
In terms of polynomial regression, what happens if you add further terms to the polynomial? (multiple correct answers)
Answer
-
the fit will automatically improve
-
there is a risk of over-fitting the model
-
the significance level associated with the F-statistic changes
-
the R-squared value will increase
Question 64
Question
In terms of nonlinear regression, why would you want to try multiple starting parameters?
Answer
-
to ensure that the interaction between the variables is taken into account
-
to ensure that the computer has found the global minimum
-
to ensure that the computer has found the local minimum
-
to ensure that an accurate scientific relationship is found
Question 65
Question
How would you calculate the Sum of Squares (SS)?
Answer
-
add all the standard deviations together and square that value
-
square the mean from each sample and add those together
-
square each standard deviation and add them all together
-
square each standard deviation and add this to the variance
Question 66
Question
Variance is calculated by doing what?
Answer
-
dividing the standard deviations by the degrees of freedom
-
dividing the sum of squares by the degrees of freedom
-
multiplying the degrees of freedom by the mean
-
multiplying the standard deviations by the sum of squares
Question 67
Question
How do we define the normal distribution curve?
Answer
-
the population mean is the height and the sum of squares is the distance from the midline of the curve to the edge
-
the variance is the height and the population mean is the distance from the midline of the curve to the edge
-
the population standard deviation is the height and the population mean is the distance from the midline of the curve to the edge
-
the population mean is the height and the population standard deviation is the distance from the midline of the curve to the edge
Question 68
Question
How do you calculate a z-score?
Answer
-
(x - mean) /sd
-
(x - sd)/mean
-
(mean-x)/sd
-
(x + mean)/sd
Question 69
Question
Choose all of the correct statements
Answer
-
approximately 99% of normally-distributed values lie between +- 2 sds from the mean
-
approximately 95% of normally-distributed values lie between +-2 sds from the mean
-
approximately 99.9% of normally-distributed values lie between +- 2.6 sds from the mean
-
approximately 99% of normally-distributed values lie between +- 2.6 sds from the mean
-
approximately 99.9% of normally-distributed values lie between +- 3 sds from the mean
-
approximately 95% of normally-distributed values lie between +- 3 sds from the mean
Question 70
Question
How do you calculate SEM and therefore, confidence intervals?
Answer
-
SEM = sd x square root of n and therefore a 95% CI would be +- 1.96 x SEM
-
SEM = sd/square root of n and therefore a 95% CI would be +- 3 x SEM
-
SEM = sd x square root of n and therefore a 95% CI would be +- 2.6 x SEM
-
SEM = sd/square root of n and therefore a 95% CI would be +- 1.96 x SEM
Question 71
Question
Which statement is true?
Answer
-
P < 0.05 means that 5% of the results arose by chance if the null hypothesis is true
-
P < 0.05 means <5% probability of the results arising by chance if the null hypothesis is true
-
P < 0.05 means <0.05% probability of the results arising by chance if the null hypothesis is true
-
P < 0.05 means that <0.5% probability of the results arising by chance if the null hypothesis is true
Question 72
Question
Choose the correct statements
Answer
-
type 1 error rate is conventionally set to 5% ( P < 0.05)
-
type 2 error rate is conventionally set to 5% ( P < 0.05)
-
type 1 error rate = 1 - power
-
type 2 error rate = 1 - power
-
if you accept a statistical power of 80% it will mean that you have a type 2 error rate of 20%
-
if you accept a statistical power of 80% it will mean that you have a type 1 error rate of 20%
Question 73
Question
What happens if you design an experiment with 3 groups and are tempted to test for differences between the means using 3 separate t-tests? (multiple correct answers)
Answer
-
you will increase the chance of making a type 2 error
-
you will increase the chance of making a type 1 error
-
you will inflate your p-value
-
you will decrease your p-value
Question 74
Question
Which statements are correct regarding the Pearson Correlation Coefficient?
Answer
-
+- 0.5 is a large effect
-
+- 0.1 is a small effect
-
+- 1 is a small effect
-
it measures how close the data points are to a straight line that best describes the linear relationship
-
r = +0.1 refers to a perfect straight line with a positive slope
-
r = -1 refers to a perfect straight line with a negative slope
Question 75
Question
How is the line of best fit created in simple linear regression?
Answer
-
by minimising the total sum of squares
-
by minimising the sum of squares of the residuals
-
by creating an equation which fits the model best
-
by entering the data into the computer in Hierarchical form
Question 76
Question
How do you calculate R squared?
Answer
-
1 - (SS of the residuals/total SS)
-
1 + (SS of the residuals/total SS)
-
1 - (total SS/SS of the residuals)
-
1 + (total SS/SS of the residuals)
Question 77
Question
Shapiro Wilk's test is used to...
Answer
-
check for sphericity
-
correct degrees of freedom
-
ascertain that residuals are random and normally distributed
-
minimise the sum of squares of the residuals
Question 78
Question
When entering more than 2 categories as dummy variables... (multiple correct answers)
Answer
-
the thing that you're comparing the baseline to gets a 1
-
the thing that you're comparing the baseline to gets a 0.1
-
1 fewer dummy variables than number of categories
-
baseline condition gets a value of 0
-
baseline condition gets a value of 1.5
Question 79
Question
Bonferroni test on its own - the p-values need to be less than what to claim significance?
Answer
-
0.05/number of categories
-
0.05/n
-
0.05/number of comparisons
-
0.05/variance
Question 80
Question
Normally distributed variables X and Y are significantly correlated with a p level of 0.006 and a Pearson’s correlation coefficient of 0.468. Approximately how much of the variability in X and Y can be explained by this correlation?
Answer
-
32%
-
47%
-
22%
-
13%
Want to create your own Quizzes for free with GoConqr? Learn more.