1584565
Description
Quiz by mlmallamas, updated more than 1 year ago
|
|
Created by mlmallamas
over 9 years ago
|
|
Question 1
Question
A crop scientist is conducting research with a drought resistant corn hybrid. She is interested in determining if increasing the spacing between these plants will increase yield. She prepares 20 single acre plots and randomly assigns 10 to have normal spacing while the other 10 are planted with an expanded spacing. The resulting average yield for each group of 10 plots was recorded.
Answer
-
The explanatory variable is whether the corn plants had normal spacing or expanded spacing
-
The response variable is the yield of the crops.
-
The explanatory variable is the yield of the crops.
-
The response variable is whether the corn plants had normal spacing or expanded spacing.
-
This study is best described as an experiment.
-
This is best described as an observational study.
Question 2
Question
Does daily cardio exercise make subjects perform better on tests of intelligence? A study was conducted in which the daily habits of 45 college students were documented, focusing on the number of hours spent on exercise in a week.After a week, the subjects were given a computer-based intelligence test on which they receive a score on a 0 to 100 point scale.Their scores were compared with how many hours they spent exercising that week.
Answer
-
The explanatory variable is the score on the computer-based intelligence test.
-
The response variable is the score on the computer-based intelligence test.
-
The explanatory variable is the number of hours exercised during the week.
-
The response variable is the number of hours exercised during the week.
-
This is best described as an observational study
-
This study is best described as an experiment.
Question 3
Question
About 870 men took part in a study to study the effectiveness of a hormone therapy. Half of the men were selected randomly to come in and receive the hormone therapy while the other half were told to stay home and thus did not receive the therapy. After about a year, blood tests were conducted on each subject by a lab technician who was aware of which group (treatment or those given nothing) the blood samples originated from. In presenting the results of the experiment, the authors reported that the men in the treatment group had experienced a statistically significant increase in HDL (the so-called "good" cholesterol) and a statistically significant reduction in LDL (the so-called "bad" cholesterol) when compared with the control group.
Answer
-
This study would be classified as double-blind.
-
This study would be classified as single-blind.
-
This study would be classified as un-blinded.
-
The subjects are the 870 men in the study.
-
The subjects are the blood tests.
-
The treatments are the HDL and the LDL.
-
The treatments are the hormone therapy or the absence of it.
-
This is an example of a completely randomized design.
-
This is an example of a block design.
-
This is an example of a matched pairs design.
Question 4
Question
A personal trainer believes that his new workout plan of lifting weights combined with cardio may help his clients lose more body fat than a workout plan of just cardio. To test his theory, he asks locals to sign up to participate in his study. 36 men and 24 women sign up for the study. The trainer also thinks the treatment will work differently on men and women. Therefore, he divides the group into men and women and then randomizes the two treatments within each group. The trainer measures the body fat of each participant, and then measures it again after three months when the workout plan has been completed.
Answer
-
This is an example of a block design.
-
This is an example of a completely randomized experiment.
-
This is an example of a matched pairs experiment.
-
The subjects are the 36 men and 24 women.
-
The subjects are the body fat measurements of the participants.
-
The treatments are the cardio/weights program and the cardio program.
-
The treatments are the body fat measurements of the participants.
Question 5
Question
Use the following information to answer questions 1 through 3.
Dr. Cawood's class is presented with a large bin that contains small plastic beads. The beads in the box are either purple or white. Dr. Cawood states that 25% of the beads are purple but Oliver, a student in Dr. Cawood's class believes that more than a quarter of the beads in the model box are purple.
Select both a null and alternative hypothesis that represent this situation. Be careful of notation.
Answer
-
HA: p=0.25
-
HA: p≥0.25
-
H0: p<0.25
-
H0: p>0.25
-
HA: p≠0.25
-
H0: p=0.25
-
HA: p<0.25
-
HA: p>0.25
Question 6
Question
Use the following information to answer questions 1 through 3.
Dr. Cawood's class is presented with a large bin that contains small plastic beads. The beads in the box are either purple or white. Dr. Cawood states that 25% of the beads are purple but Oliver, a student in Dr. Cawood's class believes that more than a quarter of the beads in the model box are purple.
Oliver takes a random sample of beads and finds that 16 out of the 44 beads sampled are purple. What is the p-value associated with the hypothesis test from Question 1?
Give your answer to 4 decimal places. For help on how to input a numeric answer, please "Instructions for inputting a numeric response."
Answer
-
.0465
-
.0338
-
.5920
-
.0512
Question 7
Question
Based on the p-value that you calculated in Question 6, what conclusion can be made about your hypothesis?
Answer
-
There is enough evidence to suggest that the proportion of purple beads in the model box is more than 25%
-
There is enough evidence to suggest that the proportion of purple beads in the model box is less than 25%
-
There is enough evidence to suggest that the proportion of purple beads in the model box is equal to 25%
-
There is not enough evidence to suggest that the proportion of purple beads in the model box is more than 25%
-
There is not enough evidence to suggest that the proportion of purple beads in the model box is less than 25%
-
There is not enough evidence to suggest that the proportion of purple beads in the model box is equal to 25%
Question 8
Question
A large office building has four entrances through which people can enter. One of the four entrances has had improved landscaping installed. An industrial psychologist wanted to see if people tend to use the entrance that has the improved landscaping more often. Using the buildings video survillance system he randomly selected 200 people who entered the building. He found that 80 (40%) of the 200 entered through the improved entrance. He would like to determine if this significantly more than we would expect if all the entrances were equally likely. To determine this he will conduct a test of
H0: p=0.25
Ha: p>0.25
In carrying out his test what null distribution should he use?
Answer
-
A normal distribution centered at 0.25 with standard deviation 0.035
-
A normal distribution centered at 0.40 with standard deviation 0.035
-
A normal distribution centered at 0.40 with standard deviation 0.030
-
A normal distribution centered at 0.25 with standard deviation 0.030
Question 9
Question
We are conducting a test of the hypotheses
H0: p=0.2
Ha: p>0.2
We find a test statistic of Z=1.32. What is the corresponding p-value? Give your answer as a proportion between 0 and 1 to 4 decimal places.
Answer
-
.0934
-
.0372
-
.0561
-
.0833
Question 10
Question
We are conducting a test of the hypotheses
H0: p=0.2
Ha: p≠0.2
We find a test statistic of Z=1.24. What is the corresponding p-value? Give your answer as a proportion between 0 and 1 to 4 decimal places.
Answer
-
.2150
-
.3463
-
.2319
-
.5639
Question 11
Question
An official with campus dining services claimed that a majority of the students at her university had a campus meal plan. A reporter for the campus newspaper was skeptical of this and decided to investigate the situation. She took a random sample of 75 students and asked them if they had a meal plan. She then used Statcrunch software to construct the following output. What conclusion should we make from this output?
Hypothesis test results:
Outcomes in : meal_plan
Success : Yes
p : Proportion of successes
H0 : p = 0.5
HA : p < 0.5
Variable Count Total Sample Prop. Std. Err. Z-Stat P-value
meal_plan 33 75 0.44 0.0577 -1.039 0.1493
Answer
-
We should reject the null hypothesis and conclude there is evidence that less than half the students have a meal plan.
-
We should NOT reject the null hypothesis and conclude there is evidence that less than half the students have a meal plan.
-
We should NOT reject the null hypothesis and there is insufficient evidence to conclude that less than half of the students have a meal plan.
-
We should reject the null hypothesis and there is insufficient evidence to conclude that less than half of the students have a meal plan.
Question 12
Question
The term statistical significance means
Answer
-
the test statistic is close to what we would expect if the null hypothesis is true.
-
the null hypothesis is true.
-
the result we see is unlikely to happen just by random chance.
-
the results are important and will make a practical difference in the lives of the subjects.
Question 13
Question
We would like to test the hypotheses
We find t=2.33 with 10 degrees of freedom. What is the appropriate p-value.
Image:
hyp_great.gif (image/gif)
Answer
-
0.05>p-value>0.02
-
0.025>p-value>0.01
-
0.05>p-value>0.025
-
0.005>p-value
Question 14
Question
We would like to test the hypotheses
We find t=1.73 with 5 degrees of freedom. What is the appropriate p-value.
Image:
hyp_not.gif (image/gif)
Answer
-
0.05>p-value>0.02
-
0.025>p-value>0.01
-
0.20>p-value>0.10
-
0.10>p-value>0.05
Question 15
Question
An environmental researcher is concerned that a new industrial plant has made the water in a nearby stream more acidic. The pH measures the amount of acidity or alkalinity of a substance (Pure water would have a pH of 7, numbers lower than 7 indicate acids, numbers greater than 7 indicate alkaline bases). The researcher would like to conduct a test of hypothesis to determine if the water is significantly acidic.
Select a correct null and alternative hypotheses.
Answer
-
H0: μ = 0
-
H0: μ = 7
-
H0: μ ≠ 7
-
H0: = 0
-
HA: μ ≠ μ0
-
HA: μ < 7
-
HA: μ > 7
-
HA: μ< 0
Question 16
Question
An environmental researcher is concerned that a new industrial plant has made the water in a nearby stream more acidic. The pH measures the amount of acidity or alkalinity of a substance (Pure water would have a pH of 7, numbers lower than 7 indicate acids, numbers greater than 7 indicate alkaline bases). The researcher would like to conduct a test of hypothesis to determine if the water is significantly acidic.
The researcher collected 27 water samples and found an average pH of 6.3 with a sample standard deviation of 1.86. What is the test statistic for this sample?
Give your answer to 2 decimal places. For help on how to input a numeric answer, please see "Instructions for inputting a numeric response."
Answer
-
-1.96
-
1.96
-
-2.31
-
2.57
Question 17
Question
A factory produces rubber hoses for the automotive industry. The factory has two inspectors (Joe and Sam) who measure the final products to make sure that they are the correct length. The factory manager wants to determine if there is a significant difference in the measurements made by these two individuals. He has each of them measure the same set of 15 hoses. Assume that the differences are calculated as Joe - Sam.
Select all of the correct null and alternative hypotheses.
Answer
-
H0: μ = 0
-
H0: μ = 15
-
H0: = 0
-
H0: μ ≠ 0
-
HA: μ ≠ 0
-
HA: μ ≠ 15
-
HA: μ < 15
-
HA: μ > 0
Question 18
Question
A factory produces rubber hoses for the automotive industry. The factory has two inspectors (Joe and Sam) who measure the final products to make sure that they are the correct length. The factory manager wants to determine if there is a significant difference in the measurements made by these two individuals. He has each of them measure the same set of 15 hoses. Assume that the differences are calculated as Joe - Sam.
The resulting measurements (in cm) have been saved in StatCrunch (http://www.statcrunch.com/app/index.php?dataurl=http%3A%2F%2Fwww.stat.ncsu.edu%2Fcourses%2Fst311%2Fdata%2FJoeandSam2.txt&dlim=any&ft=truehttp%3A%2F%2F). Use the data to compute the test statistic and p-value for the difference between Joe and Sam.
The resulting test statistic is _______
The resulting p-value is ______
Answer
-
-2.357, .0335
-
-2.794, .0537
-
2.794, .0335
-
4.673, .3623
Question 19
Question
From this hypothesis test, choose the correct conclusions.
Select all that apply.
Answer
-
We reject the null hypothesis.
-
We fail to reject the null hypothesis.
-
We conclude that there is a significant statistical difference between the two employees' measurements.
-
We conclude that there is not a significant statistical difference between the two employees' measurements.
-
On average in the sample, Sam has larger values than Joe
-
On average in the sample, Joe has larger values than Sam.
-
We can not tell whether Joe or Sam has larger values on average.
Question 20
Question
A researcher wanted to know if there was a difference in fall and spring semester tuition at universities across the U.S. His study took a random sample of 200 universities, had a p-value of .013 and found that the tuition had increased by $0.35 between fall and spring semester. What can be said about the results of this study?
Answer
-
The results were statistically significant but not practically significant.
-
The results were practically significant but not statistically significant.
-
The results were both statistically significant and practically significant.
-
The results were neither statistically significant nor practically significant.
Question 21
Question
Which of the following numbers represents the correlation for the above scatter plot?
Image:
scatterplot-.49 (image/png)
Answer
-
-.49
-
-.95
-
-.98
-
.57
-
.34
-
.89
Question 22
Question
Which of the following numbers represents the correlation for the above scatter plot?
Answer
-
.82
-
.50
-
.99
-
-.27
-
-.56
Question 23
Question
Which of the following are true about the correlation coefficient r?
Select all that apply.
Answer
-
The correlation coefficient is always greater than 0.
-
The correlation coefficient is always between -1 and +1.
-
The correlation coefficient will change if we change the units of measure
-
If the correlation coefficient is positive, the slope of the regression line will also be positive.
-
If the correlation coefficient is +1, then the slope of the regression line is also +1.
-
If the correlation coefficient is close to 0, that means there is a strong linear relationship between the two variables.
Question 24
Question
The coefficient of determination, r2, for the above scatter plot is 0.138. What is the correlation coefficient, r?
Give your answer to 3 decimal places. For help on how to input a numeric answer, please see "Instructions for inputting a numeric response."
Answer
-
-.371
-
-.406
-
.249
-
-.053
Question 25
Question
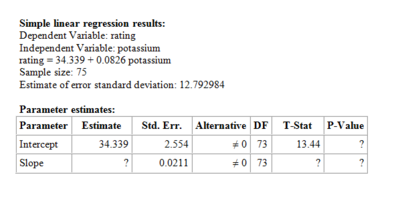
A simple linear regression is performed in StatCrunch, and you receive the following output:
What is the slope of the regression line?
What is the intercept of the regression line?
Image:
potassium (image/png)
Answer
-
.0826, 34.339
-
.0739, 36.582
-
.0517, 33.844
Question 26
Question
A curious college student is interested in how the number of pages in a book affects the price of the book. His conjecture is that as the number of pages goes up, so does the price of the book.
To test his conjecture, you will perform a simple linear regression in StatCrunch on the variables Pages (the number of pages in the book) and Amazon (the price of the book at Amazon). Click this link to get to the data set in StatCrunch.
http://www.statcrunch.com/app/index.php?dataurl=http%3A%2F%2Fwww.stat.ncsu.edu%2Fpeople%2Fwoodard%2Fcourses%2Fst311%2Fdata%2FBooks.xls&dlim=any&ft=true
What is the equation of the regression line?
What is the correlation coefficient?
Answer
-
Amazon=12.633+.1039*pages .6387
-
Amazon=13.923+.1822*pages .7414
-
Amazon=11.352+.2584*pages
Question 27
Question
A simple linear regression was performed in StatCrunch about the relationship between price and square footage of homes in Albuquerque, NM. The following equation for the regression line was given:
PRICE = 47.82 + 61.367 SQFT
If a home about to go on the market has 2100 square feet, what is its predicted selling price?
Give your answer to the nearest dollar. For help on how to input a numeric answer, please see "Instructions for inputting a numeric response."
Answer
-
128919
-
137254
-
120463
-
131834
Question 28
Question
A simple linear regression was performed in StatCrunch about the relationship between price and square footage of homes in Albuquerque, NM. The following equation for the regression line was given:
PRICE = 47.82 + 61.367 SQFT
Carrie's home has 1894 square feet, and is worth $113,500. What is the residual value?
Give your answer to the nearest dollar. For help on how to input a numeric answer, please see "Instructions for inputting a numeric response."
Answer
-
-2777
-
2777
-
-6284
-
6284
Question 29
Question
We would like to test the hypotheses
We find t=2.33 with 10 degrees of freedom. What is the appropriate p-value.
Image:
hyp_not__1_.gif (image/gif)
Answer
-
0.05>p-value>0.02
-
0.025>p-value>0.01
-
0.05>p-value>0.025
-
0.005>p-value
Question 30
Question
The resulting measurements (in cm) have been saved in StatCrunch. Use the data to compute the test statistic and p-value for the difference between Joe and Sam.
http://www.statcrunch.com/app/index.php?dataurl=http%3A%2F%2Fwww.stat.ncsu.edu%2Fcourses%2Fst311%2Fdata%2FJoeandSam2.txt&dlim=any&ft=truehttp%3A%2F%2F
Find the test statistic and the p-value.
Answer
-
-2.357, .0335
-
-3.584, .0253
-
2.744, .0237
-
3.629, .8342
Question 31
Question
From this hypothesis test, choose the correct conclusions.
Answer
-
We reject the null hypothesis.
-
We fail to reject the null hypothesis.
-
We conclude that there is a significant statistical difference between the two employees' measurements.
-
We conclude that there is not a significant statistical difference between the two employees' measurements.
-
On average in the sample, Sam has larger values than Joe.
-
On average in the sample, Joe has larger values than Sam.
-
We can not tell whether Joe or Sam has larger values on average.
Question 32
Question
Which of the following are true statements about the p-value and hypothesis tests?
Select all that apply.
Answer
-
The p-value is the probability the alternative hypothesis is correct.
-
The p-value is one minus the probability the alternative hypothesis is correct
-
If the p-value is large it indicates we did not calculate the test statistic correctly.
-
The p-value is calculated assuming the null hypothesis is true.
-
The p-value is calculated assuming the alternative hypothesis is true.
-
If the p-value is small it indicates the data is unlikely under the null hypothesis.
-
A hypothesis test for the mean can be run for a simple random sample of 20 observations from a non-normal population.
-
A hypothesis test for the mean can be run for a simple random sample of 45 observations from a non-normal population.
-
A hypothesis test for the mean can be run for a convience sample of 20 observations from a normal population.
-
A hypothesis test for the mean can be run for a simple random sample of 20 observations from a normal population.
Question 33
Question
Which of the following are necessary conditions to perform inference in regression? (Select all that apply).
Answer
-
There should not be any extreme outliers that influence the results unduly.
-
The standard deviation of the values of y around the regression line should be the same regardless of the values of x.
-
The distribution of the values around the regression line should have a normal distribution.
-
The values of x should NOT have a correlation with the values of y.
-
The x values must have a normal distribution centered at 0.
-
The values of y must have a normal distribution centered at 0.
Question 34
Question
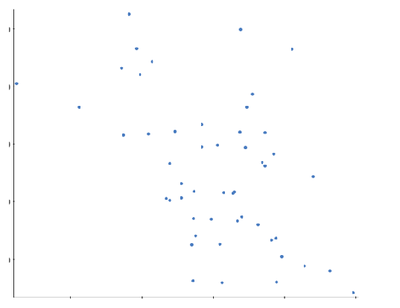
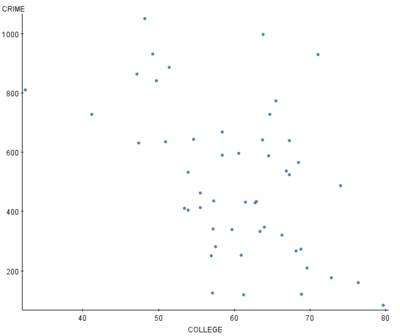
Below is a scatter plot of data comparing the percentage of a state's population enrolled in college versus the number of crimes per 100,000 people. An officer at the Bureau of Justice Statistics wanted to determine the amount of crimes that should be expected if only 20% of a state's population was college educated. Is it appropriate to predict the crime for a state with 20% having a college education?
Image:
Scatter_Plot-.49 (image/png)
Answer
-
Yes, as long as we can find the regression line.
-
No, because we would be trying to find a value outside of our data range.
-
Yes, because the slope of the regression line will be negative.
-
Yes, because the y-intercept of the regression line will be positive.
-
No, because the data is not at all linear.
Question 35
Question
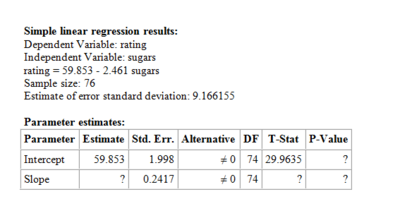
A nutrition enthusiast gathered a database on different types of cereals and their nutritional facts. Among other data in this set, one value given is the National Food Board's overall rating of the cereal. The nutrition enthusiast would like to know if there is a correlation between a cereal's rating and the amount of sugar in that cereal. Based on the StatCrunch output below, do we have reason to believe that there is non-zero slope between the amount of sugar in a cereal and the cereal's health rating?
Image:
sugars (image/png)
Answer
-
No, because the p-value is less than .05
-
No, because the p-value is more than .05
-
Yes, because the p-value is less than .05
-
Yes, because the p-value is more than .05
-
We can not make a decision from the given information.
Question 36
Question
A researcher interested in the habits of smokers collected data on the number of cigarettes smoked in one month and the number of time they visited church that month. The correlation for these two variables ended up being -0.74. If a smoker who had never been to church started attending church regularly what does this imply about the future habits of the smoker?
Answer
-
The smoker will smoke more cigarettes.
-
The smoker will smoke less cigarettes.
-
We can not conclude that church attendance will affect the future smoking habits of this person.
-
he smoker will not attend church for very long.
Question 37
Question
A crop scientist is conducting research with a drought resistant corn hybrid. She is interested in determining if increasing the spacing between these plants will increase plant height. She prepares 20 single acre plots and randomly assigns 10 to have normal spacing while the other 10 are planted with an expanded spacing. The resulting average height for each group of 10 plots was recorded.
Answer
-
This study is best described as an experiment.
-
The response variable is whether or not the plants have normal or expanded spacing.
-
The explanatory variable is the average height for each group of 10 plots.
-
This is best described as an observational study.
-
The response variable is the average height for each group of 10 plots.
-
The explanatory variable is whether or not the plants have normal or expanded spacing.
Question 38
Question
A student group claims that first-year students at a university should study 2.5 hours (150 minutes) per night during the school week. A skeptic suspects that they study less than that on the average. A survey of 51 randomly selected students finds that on average students study 140 minutes per night with a standard deviation of 30 minutes. What conclusion can be made from this data?
Answer
-
The p-value is less than .05, therefore we conclude that students study less than 150 minutes per night.
-
The p-value is less than .05, therefore we conclude that students study greater than 150 minutes per night.
-
The p-value is less than .05, therefore we do not have enough evidence to conclude that students study less than 150 minutes per night.
-
The p-value is greater than .05, therefore we do not have enough evidence to conclude that students study less than 150 minutes per night.
-
We do not have enough information to make a conclusion about this study.
Question 39
Question
A fair six-sided die is defined as a die that will have each of the 6 faces of the die comp up one-sixth of the time in the long run. A loaded six-sided die is defined as a die that has one face of the die that comes up more often than one-sixth of the time in the long run.
An avid Yahtzee player wants to know whether or not his lucky six-sided die is loaded so that 6's appear more often than any other number. He throws his lucky die 85 times and noted that he rolled a 6 on 18 of those rolls. What are the hypothesis and conclusion for this experiment?
Answer
-
H0: p = 0
-
H0: p = 1/6
-
H0: p = 6
-
HA: p > 0
-
HA: p > 1/6
-
HA: p > 6
-
We conclude that the die is loaded since the p-value is greater than .05.
-
We conclude that the die is loaded since the p-value is less than .05.
-
We conclude there is no evidence that the die is loaded since the p-value is greater than .05.
-
We conclude there is no evidence that the die is loaded since the p-value is less than .05.
Question 40
Question
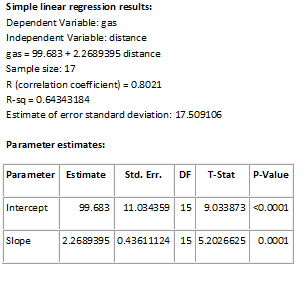
Data were collected on distance between a person's home and primary work location (distance) and the person's monthly expenditures on gasoline for their vehicle (gas) for 17 individuals. The regression analysis is given below.
One of the 17 individuals in the sample lived 12 miles from work and spent $130.45 on gas. What is this individual's residual value?
Give your answer to 2 decimal places. For help on how to input a numeric answer, please see "Instructions for inputting a numeric response."
Image:
distance_gas_3 (image/png)
Answer
-
3.54
-
-3.54
-
2.75
-
-2.75
Question 41
Question
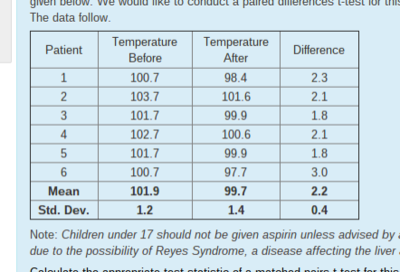
A study is conducted to see how effective aspirin is in reducing temperature in children. A sample of 6 children suffering from influenza had their temperatures taken immediately before and 1 hour after administration of aspirin. The results are given below. We would like to conduct a paired differences t-test for this situation. The data follow.
Calculate the appropriate test statistic of a matched pairs t-test for this data to see if taking aspirin will reduce a child's fever. You may assume the necessary conditions hold. Give answers to 2 decimal places.
Answer
-
13.47
-
2.57
-
11.68
-
.04
Want to create your own Quizzes for free with GoConqr? Learn more.