
Notizen
Chapter 10
Inhalt der Notizen (1)
Seite 1
A. Correlational Research Approach
i. This type of strategy
a. Describes relationships between variables
1. What is the nature/direction of the relationship? (Positive? Negative?)
2. How strong is the relationship?
3. What is the form of the relationship? (linear? Curvilinear?)
b. Does not explain the cause of the relationship
ii. Remember: Variables are measured, not manipulated
iii. This type of research typically examines three possible associations of variables:
a. X &Y are characteristics of the same people
1. Is there a correlation between a person’s level of self-esteem (X) and level of anxiety (Y)
b. X & Y are characteristics of different, but related, sets of people
1. Is there a correlation between a child’s level of self-esteem (X) and his/her parents’ level of self-esteem (Y)?
c. X is a personal characteristic and Y is an environmental characteristic
1. Are people more likely to act aggressively (X) on hotter days (Y)
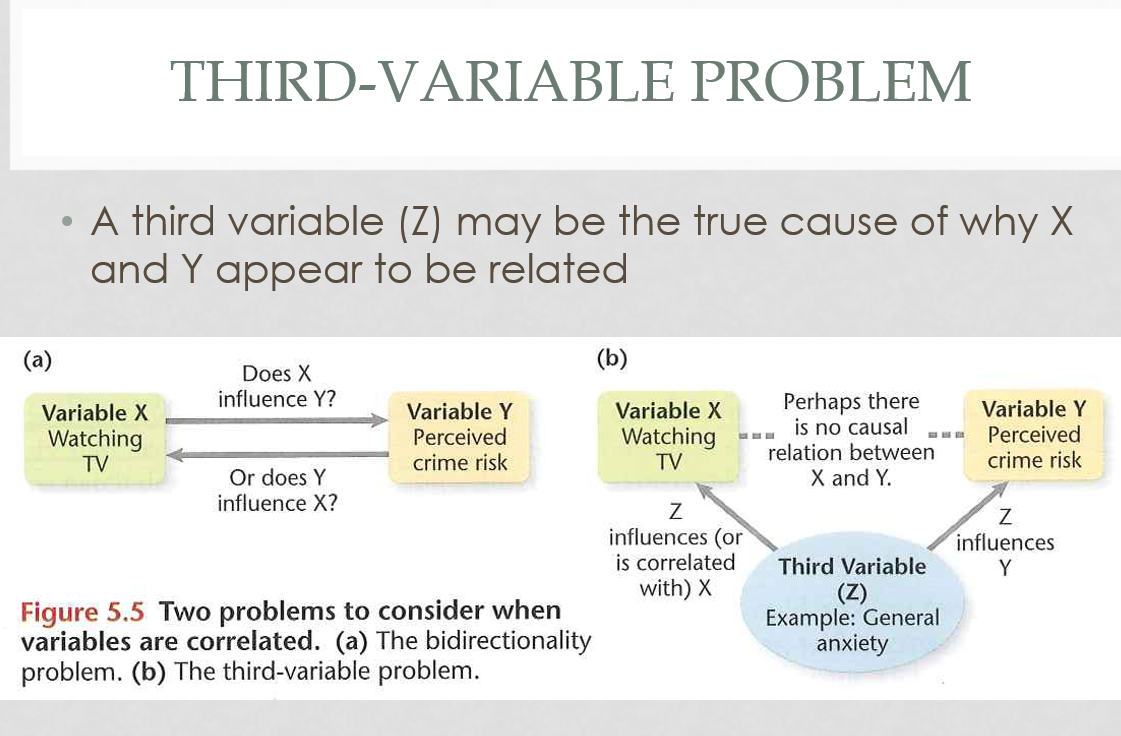
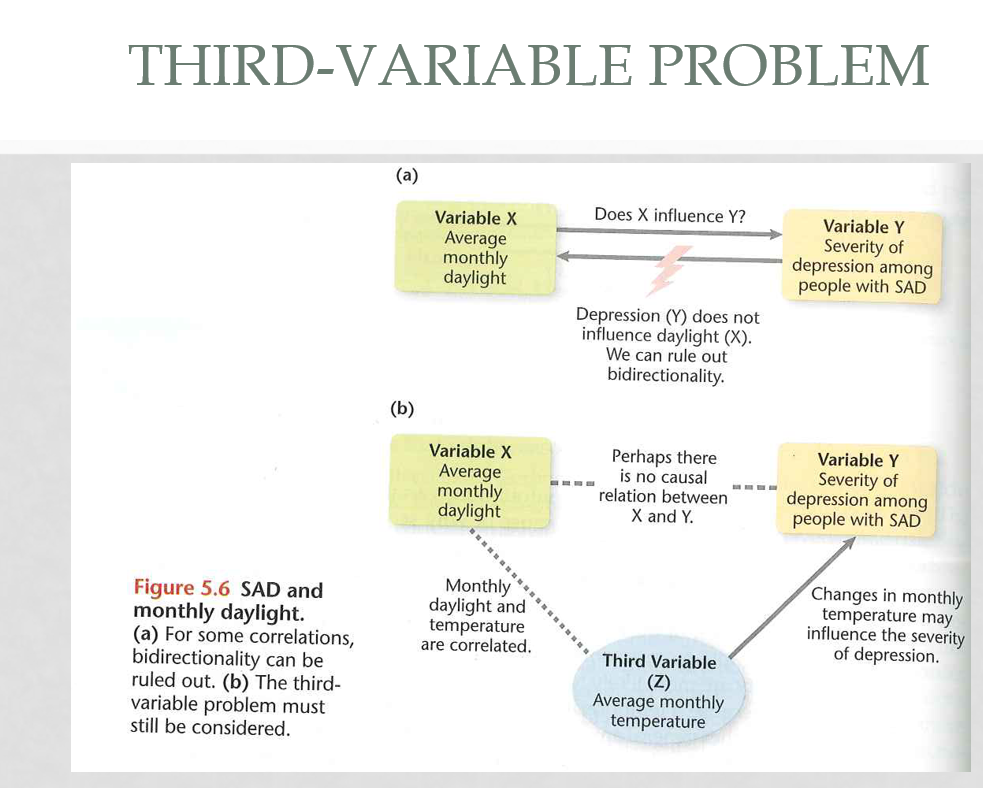
iv. Bidirectionality problem
a. Temporal order is one factor that allows us to draw causal inferences: Changes in X occur before changes in Y
1. This order is possible in correlational research
2. However, changes in Y could also occur before changes in X
b. The bidirectionality problem states that there is ambiguity about whether X caused Y or Y caused X
1. It is tempting to assume we know the direction of a relationships but this cannot be determined unless we could conduct an experiment
v. Direction of a relationship
a. Positive correlation
1. Higher scores or levels of one variable tend to be associated with higher scores or levels of another variable
2. As X increases, Y increases
3. As X decreases, Y decreases
b. Negative correlation
1. Higher scores or levels of one variable tend to be associated with lower scores of levels of another variable
2. As X increases, Y decreases
3. As X decreases, Y increases
vi. Form of a relationship
a. Linear
1. Data points cluster around straight line
2. Consistent & predictable relationship between 2 variables
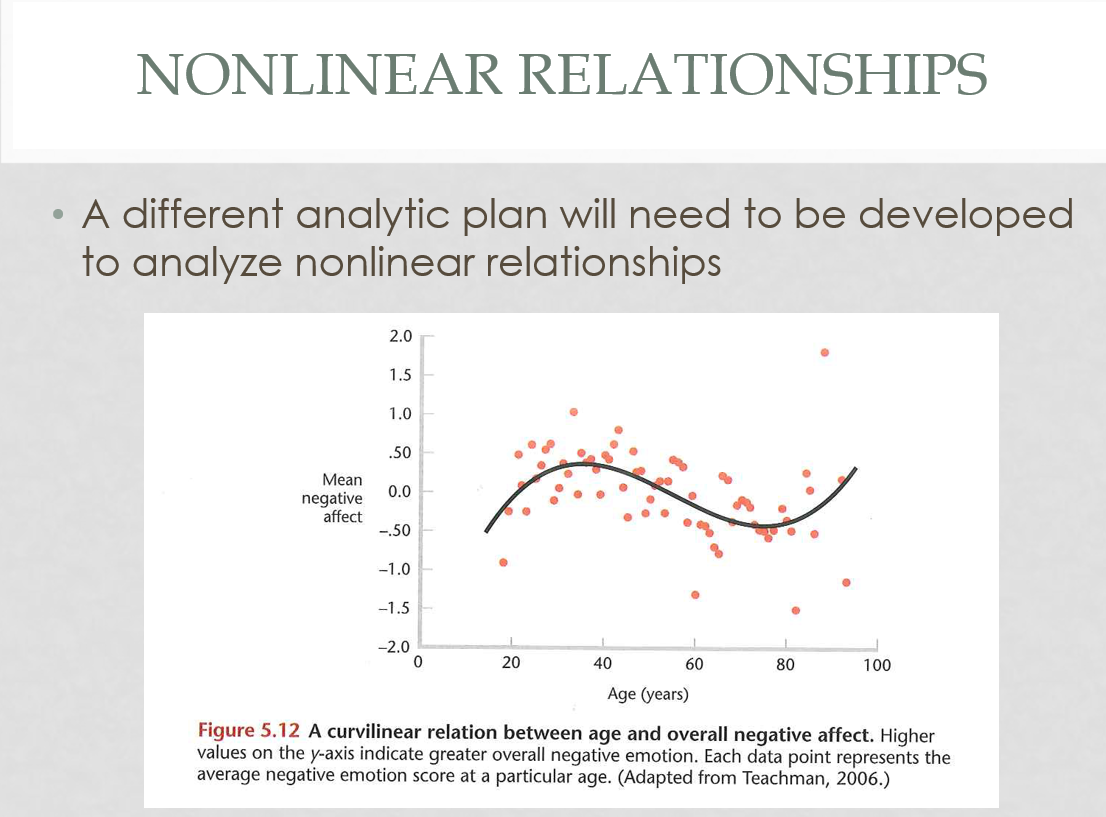
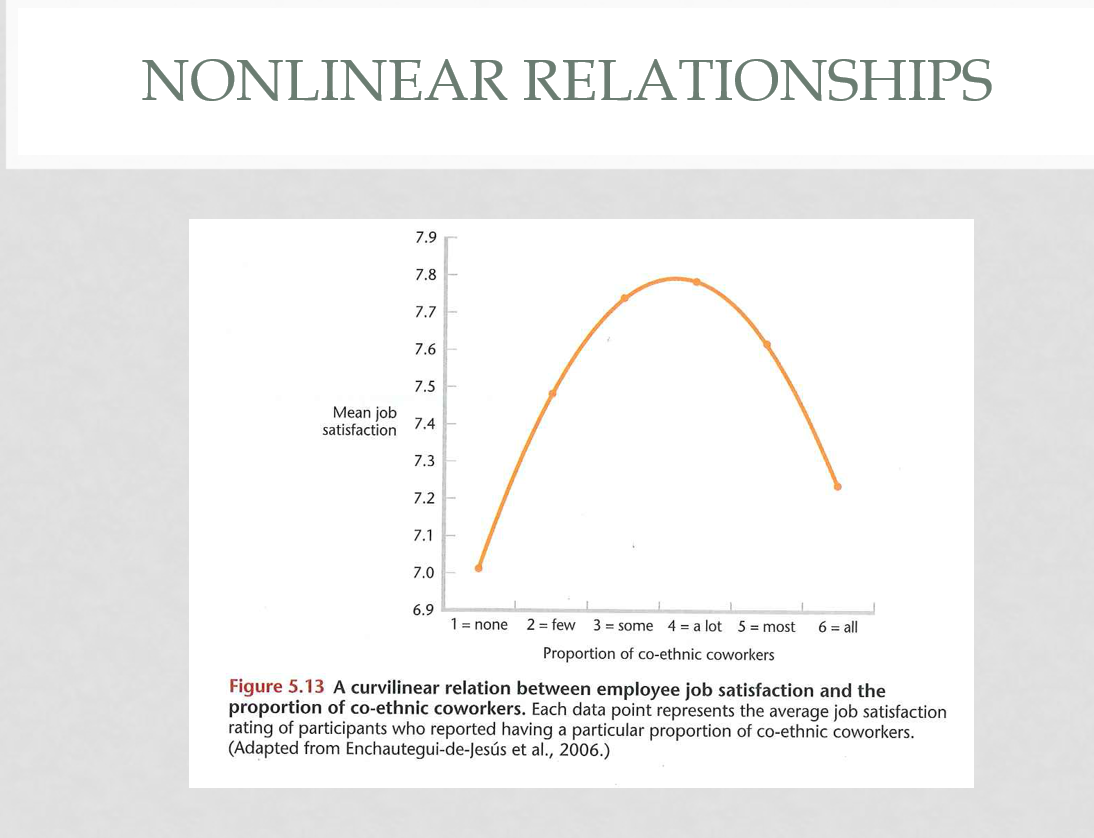
b. Curvilinear
1. Changes in one variable tend to accompany changes in another, but the amount of change is not constant (not a straight line)
vii. Strength of a relationship
a. Correlation coefficient
1. Pearson’s r
- This is a statistic that measures the direction and strength of the linear relation between two variables that have been measured on an interval or ratio scale
- Values range form +1.00 to -1.00
- + 1.00= perfect positive relationship
- -1.00= perfect negative relationship
- Focus on the number if you are interested in the strength of the relationship
- The sign tells the direction
b. Which correlation coefficients are larger?
1. The +/- doesn’t matter, just which is the number closest to 1.00
c. How do we know if a correlation is strong or weak?
d. Cohen (1988) recommendations:
1. r= .10 to .29 (small association)
2. r= .30 to .49 (medium association)
3. r= .50 to 1.00 (large association)
e. An r value cannot be interpreted as representing the percentage that two variables are related
f. Interpreting the strength involves
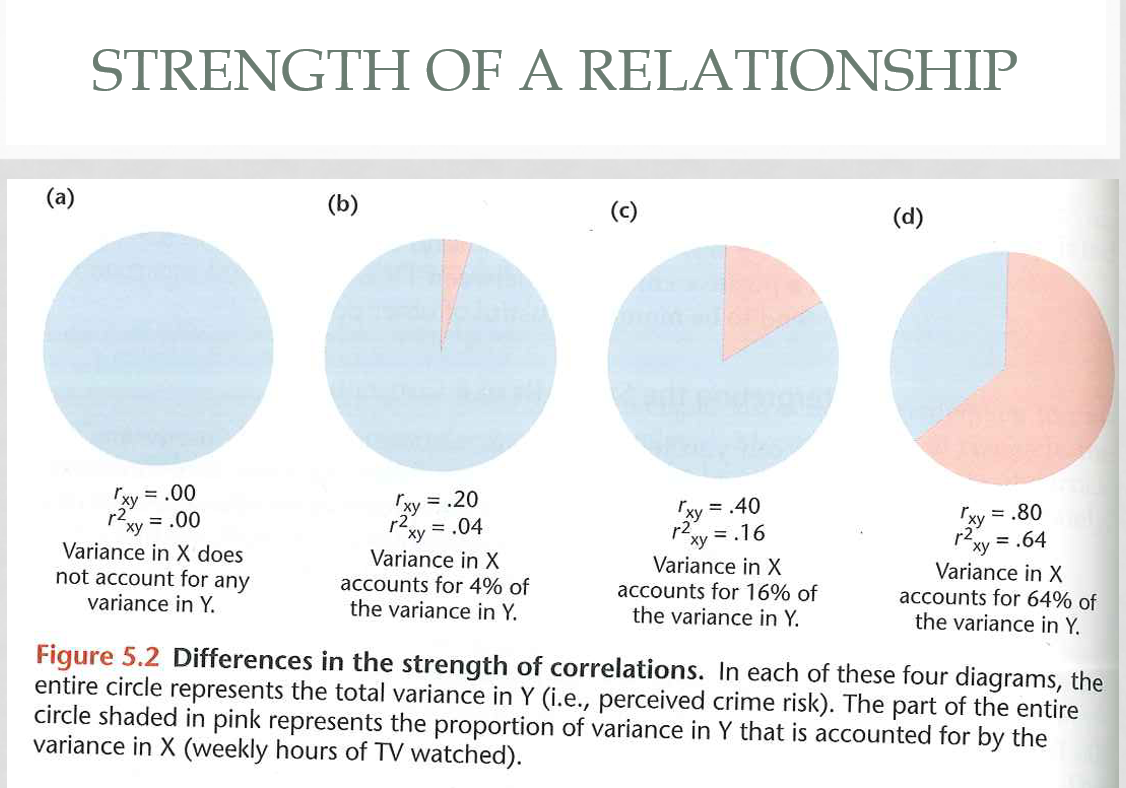
1. Variance
-This takes into account how far the scores are spread apart from their means
2. Coefficient of determination
- Pearson’s r is squared
- r^2 is the coefficient of determination, which tells us the extent to which differences among the X scores predict (statistically account for) differences among the Y scores, based on the linear relationship between the two variables
viii. Regression
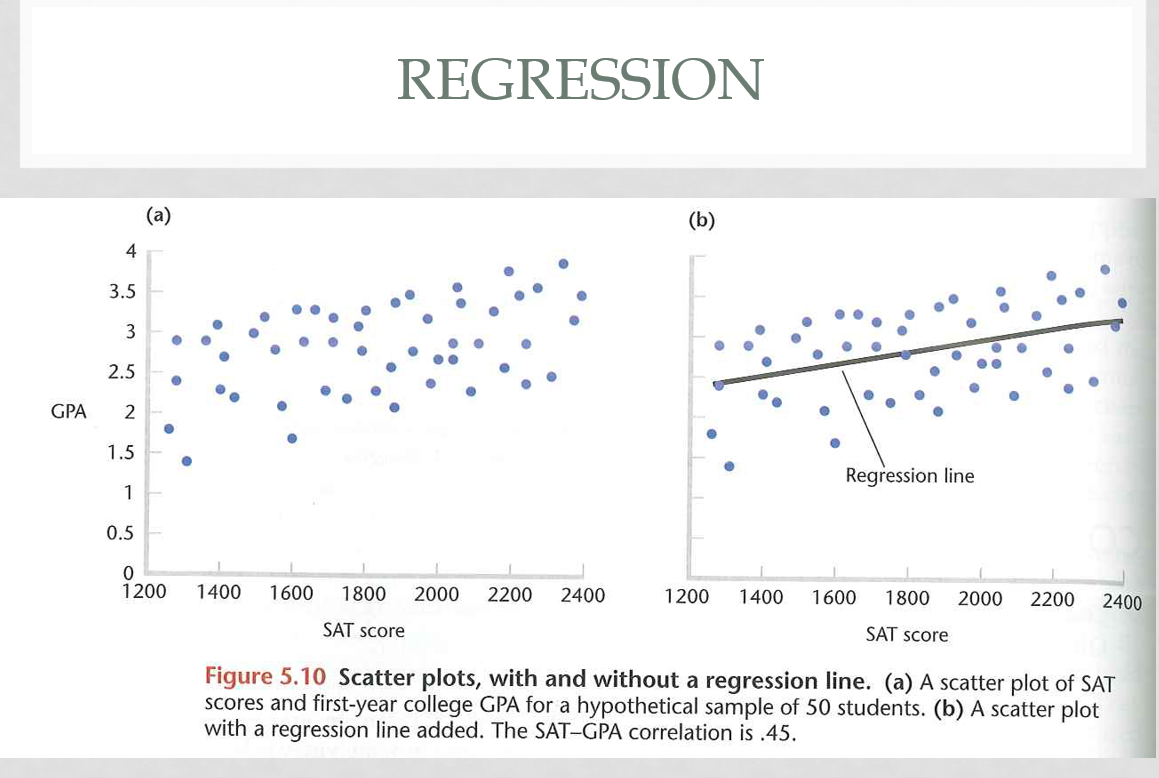
a. Simple linear regression
1. Explores the quantitative, linear relation between two variables
2. It is often used to predict the scores of one variable based on the scores of another variable
3. Example:
- SAT scores (predictor variable, X) are used to estimate year 1 college GPA (criterion variable, Y)
b. Multiple regression
1. Explores the linear relationship between one variable and a set of two or more other variables
2. Example:
- SAT scores (predictor variable, X) and high school GPA (predictor variable, X_2) are used to estimate year 1 college GPA (criterion variable, Y)
- The sample of participants needs to be larger with multiple regression compared to simple regression
- The more predictors, the larger the sample needs to be
ix. Benefits of correlational research
a. Prediction in daily life
b. Validating tests
c. Answering questions when an experiment cannot be conducted
d. Hypothesis and theory testing
e. The synergy with experiments
B. What is observational research?
i. It is the process by which a researcher observes and systematically records the behavior of individuals
a. Can be used for exploratory studies or used to test hypothesis and theory
b. This type of research may suggest possible causal relations that can be studied in controlled lab experiments
ii. Requirements
a. Direct observation of behavior by a researcher
1. Problem: Behavior may be influenced by the researcher’s presence
2. Solutions:
- Conceal the observer
- Record behavior and observe later (e.g. hidden cameras)
- Habituate participants to the observer’s presence or to the presence of recording equipment
b. Systematic observation by a researcher
1. Problem: Interpretation of behavior is subjective
2. Solution:
- Develop a behavioral coding system for interpreting behavior
- Develop a list of well-defined categories of behavior
- Train researchers to use the coding system
- Use multiple observers to evaluate inter-rater reliability
iii. Methods
a. Naturalistic (undisguised or disguised)
1. Researchers passively observe behavior in a natural setting
- Undisguised v. disguised
2. Studies:
- Crowley et al. (2001) study of undisguised naturalistic observation
- Parents of girl children provide less explanation of scientific questions, than parents of boy children
- Knew they were being observed
- Remland et al. (1995) study of disguised naturalistic observation
- observing different cultures and amount of touch between people.
- Didn’t know they were being observed
3. Critique:
- High degree of external validity- observing behavior as it naturally occurs in the real world
- Time intensive –have to wait for behavior of interest to occur naturally
4. Is disguised naturalistic observation ethical
- The APA permits this type of research if the following conditions are met:
- The study is not expected to cause participants harm or distress
- Confidential information collected is protected
- If the participants’ response were to become known, this would not expose them to social, economic, or legal risks
b. Participant (undisguised or disguised)
1. The observer becomes a part of the group or social setting being studied
- Undisguised and disguised are options
- Ethnography: the systematic study of people and cultures. It is designed to explore cultural phenomena where the researcher observes society from the point of view of the subject of the study
2. Studies:
- Festinger et al. (1956)
- Participant observation joined a crazy alien cult to study cognitive dissonance. When the flood didn’t happened, they focused on requirement more members instead of disbanding
- Rosenhan (1973)
- Mentally healthy people got admired for psychiatric hospitalization. 11/12 were diagnosed with schizophrenia. The staff didn’t know they were pseudo-patients, but the actual patients could tell they were fake.
3. Critique:
- Greater opportunity to gain insight about the personal meaning of behavior to group members
- Disguised participants observation might be the only option for some circumstances
- Much greater risk of influencing behavior being studied
- Risk of losing objectivity and maintaining boundaries
c. Structured observation
1. A researcher fully or partly configures the setting in which behavior will be observed
- The tasks and situations participants are asked to do are designed to be analogues, representations, of circumstances that occur naturally
2. Pros:
- More control, which means saving time
- Lab settings provide exposure to the same environment and eliminate distractions
3. Con:
- The laboratory is not the same as real life
iv. Behavioral coding system
a. Remember, the steps involved in a coding system are:
1. Develop a list of well-defined categories of behavior
2. Train researchers to use the coding system
3. Use multiple observers to evaluate inter-rater reliability
b. Inter-rater reliability is the degree to which independent observers show agreement in their observations
c. The statistic chosen to calculate inter-rater reliability will depend on two factors:
1. The type of data recorded
2. The number of observers recording the same event
* Kappa is commonly used; represents the percentage of times that two observers agree, over and beyond the degree of agreement that would be expected to occur by chance
d. Tips for a good coding system:
1. The coding categories must be clear and mutually exclusive
2. The observers need to be well-trained so that they will assign the same codes
3. Blind observation should be used, such that observers are not aware of
- The study hypothesis
- Any information about participants that relate to the hypotheses
4. Periodic checked should be conducted to make sure the observers are using the system reliable
v. Quantifying observation
a. Behavioral observation requires converting observations into numerical scores. There are multiple techniques for achieving this:
1. Frequency method: Counting the instances of each specific behavior that occurs during a fixed time observation period
- E.g. How many aggressive acts are committed during a 30-minute period
2. Duration method: Recording how much time an individual spends engaged in a specific behavior during a fixed time observation period
- E.g. How much time do children spend playing alone v. in a group during a 30 minutes free-time period
3. Interval method: Dividing the observation period into a series of intervals and then recording whether a specific behavior occurs during each interval
- E.g. A 30 minute free-time period is divided into 30 1-minute intervals. During how many of those intervals was the child observed playing alone
vi. Sampling observations
a. Observers may find it difficult to record multiple behaviors of multiple individuals reliably. One solution is to video-record the behavior. Another solution is to sample a subset of potential observations:
1. Time sampling: Observe behavior for one-time interval, then pause during the next interval to record all observations, then repeat
- E.g. observe all instances of physical and verbal aggression for 10 minutes, then spend the next 10 minutes recording them
2. Event sampling: Record one specific event or behavior during the first interval, then switch to a different event or behavior in the next interval.
- E.g. record verbal aggression for a 10-minute interval, then record physical aggression for a 10-minute interval
3. Individual Sampling: observe and record behaviors of one individual for one-time interval, and then switch to a new individual
- E.g record peer help-seeking behavior of one study for 5-minutes, and then switch to a new individual for the next 5-minutes
Informationen
- Beschreibung
- Correlational and Observable Research
- Erstellt von
- Shelby Klein
- Aufrufe
- 14
- Bewertung