
Karteikarten
ECO 351 - Business Statistics II - Vocabulary and Equations
Karten in diesem Stapel (37)
- 1Standardized random variableA random variable x is a variable whose outcome is determined by chance
- 2StatisticA method or procedure to calculate a quantity from the sample
- 3Sampling distributionThe sampling distribution of an estimate is the probability distribution over all possible outcomes
- 4Population standard deviationIs given by σ and measures the variance from the population mean
- 5Probability Density FunctionA probability density function f(x) is a non-negative function that describes a continuous random variable X. The area under the graph is probability
- 6HypothesisStatement about a population parameter
- 7Null hypothesis H0“status quo” – something you don’t expect
= >= <= - 8Alternative Hypothesis HAWhat you expect, change from status quo – what you’re trying to confirm
/= < > - 9Regression AnalysisTechnique to quantify a relation between 2 or more variables. Uses variation in one or more variables to explain/predict variation in another variable. Regression can only establish existence of a relation. But not whether the relation is causal
- 10Stochastic Error TermA term that is added to a regression equation to introduce all of the variation in Y that cannot be explained by the included X’s.
- 11Ordinary Least Squares (OLS)A regression estimation technique that calculates the β ̂s so as to minimize the sum of the squared residuals.
- 12Multivariate Regression CoefficientIndicates the change in the dependent variable associated with a one-unit increase in the independent variable in question holding constant the other independent variables in the equation.
- 13EstimatorA statistic used to estimate a particular parameter
- 14EstimateA particular value determined by the estimators
- 156 Steps to Hypothesis TestingStep 1: Formulate null and alternate hypothesis
Step 2: Set the significance level
Step 3: Determine the critical value and rejection region of the test. The critical value z* or t* is such that a probability is in the “tails”
Step 4: Calculate the statistic using sample information and H0
Step 5: Compare value of z or t to z* or t* - Reject H0 or fail to reject H0
Step 6: State the conclusions - 16Explain the difference between µ and X ̅.µ is the population mean
X ̅ is the sample mean - 17What is the difference between an estimator and an estimate? Give an example of each.Estimator is a statistic used to estimate a particular parameter: OLS is an estimator
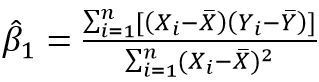
Estimate is a particular value determined by the estimators: β ̂ produced by OLS is an estimate - 18Equation to Calculate Beta Hat 1
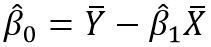
- 19Equation to Calculate Beta Hat 0
- 20TSS = RSS + ESSTotal Sum of Squares = Explained Sum of Squares + Residual Sum of Squares

- 21R^2 represents what value?coefficient of determination
(ESS / TSS) or [1 - (RSS / TSS)] - 22Formula to Calculate R^2(ESS / TSS)
or
[1 - (RSS / TSS)]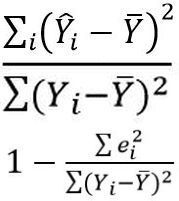
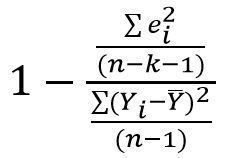
- 23Formula to Calculate Rbar^2
- 24—The Residual Value
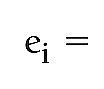

- 25Total Sum of SquaresTSS = ESS + RSS
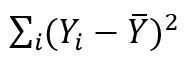
- 26Explained Sum of SquaresAttributable to the fitted regression line
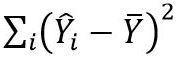
- 27Residual Sum of SquaresThe unexplained portion of TSS in an empirical sense by the estimated regression equation

- 28The Simple Correlation Coefficient, rA measure of the strength and direction of the linear relationship between two variables
1. If two variables are perfectly positively correlated, then r = +1
2. If two variables are perfectly negatively correlated, then r = -1
3. If two variables are totally uncorrelated, then r = 0 - 29Degrees of FreedomThe excess number of observations over the number of coefficients
(N - 1)
-------------
(N - K - 1) - 30R ̅^2Measures the percentage of the variation of Y around its mean that is explained by the regression equation, adjusted for degrees of freedom.
- 31Unbiased EstimatorThe estimator beta hat is an unbiased estimator if its expected value (taken with respect to its sampling distribution) is equal to the population parameters. In other words, E(Bhat) = B
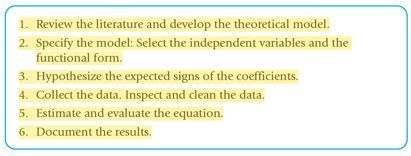
- 32Six steps of Applied Regression Analysis
- 333 components of specifying a model1) The independent variables and how they should be measured
2) the functional (mathematical) form of the variables
3) the properties of the stochastic error term - 34Specification ErrorA mistake in any of the three elements of specification
- 35dummy variableA variable that takes on the value of 1 or 0 depending on whether a specified condition holds
- 36Priorsprior theoretical beliefs, or working hypothesis, imposed on a regression equation
- 37OutlierAn observation that lies outside the range of the rest of the observations. Looking for outliers is an easy way to find data entry errors
Informationen
- Beschreibung
- Some vocabulary and equations from my Spring 2015, ECO 351 - Business Statistics II course at UNCG
- Erstellt von
- LemonKing
- Aufrufe
- 108
- Tags
- Bewertung