
Karteikarten
Population Change
Karten in diesem Stapel (62)
- 1Define: . birth rate . death rate . fertility rate. number of live births per 1000, annually
. number of deaths per 1000, annually
. average number of children woman will have between 15 and 44 - 2Define: . infant mortality rate . life expectancy . migration rate. number of deaths under age of one per 1000 live births per year
. average age a person expects to live
. difference between immigration and emigration, per 100,000 per year (net migration) - 3Define: . population density . natural change . zero growth rate. number of people per square kilometre, total population of area divided by size of area
. change in population because of difference between birth rate and death rate (not including migration)
e.g. if birth>death, grow naturally
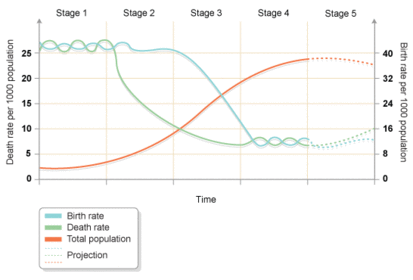
. population neither increasing nor decreasing - 4What is this and what are the other stages called?Demographic Transition Model
. high fluctuating
. early expanding expanding
. late expanding
. low fluctuating
. declining - 5Stage one . example . describe stage. tribes in rainforest of Brazil
. high birth rate and high death rate
. no birth control, education poor
. high infant mortality, so people have more children to replace dead
. LE is low due to poor health, sanitation and diet
. BR 35/100 DR 35/1000 - 6Stage two . example . describe stage. Afghanistan
. birth rate still high little birth control and education poor
. birth rate stays high for labour reasons e.g. farms
. death rate falls and LE increases improved health, sanitation and diet
. BR 35/1000 DR 15/1000 - 7Stage three . example . describe stage. Egypt
. birth rate decreases rapidly due to birth control, improvements to education
. br drops also drops as economy more industrialized- less children to work on farms
. br falls still due to women work rather than stay home
. some govs intro population policies to reduce birth rates
. BR 13/1000 DR 10/1000 - 8Stage four . example . describe stage. most of Europe and USA
. birth rate stays low due to increased access and demand for luxuries e.g. holidays means less money for having children
. fewer advantages to having children, not needed for work
. BR 10/1000 DR 10/1000 - 9Stage five . example . describe stage. Japan
. birth rate decreases children expensive and many have dependent elderly relatives, lots choose not to have children
. death rate remains steady more elderly people so more people die (old age) despite health care
. BR - 10Why are most MEDCs in their stages?. stages 4 and 5
. low BR and DR, LE slow pop growth
. stage 2 allowed industrial growth, increased farming, increased wealth
. some in stage 5 e.g. Italy BR - 11Why can stage 5 cause problems for a country?. too few children replace current ageing workforce- cause economy to slow or stop growing
. small pop reduced spending, economy to slow or stall
. fewer taxpayers, less money for services, made worse by increased spending by elderly- more old means more money for pensions and health - 12Why most LEDCs in their stages?. stages 2 and 3
. lots entered stage 2 in 1950s, improved health care and sanitation= reduced DR, BR remain high
. many become overpopulated, less resources to cope with expanding population
. some in stage 3 like NICs, DR still falling leading increasing pop, some govs introduced policies to prevent over pop - 13Stage one UK DTM. pop small e.g. 6mil in 1700
. poor diet, hygiene
. wars, diseases e.g. black death and cholera
. high DR cancelled out by high BR - 14Stage 2 UK DTM. pop grew quickly- X5 bigger by 1880s
. improvements in farming, medicine reduced starvation and disease
. DR fell
. BR remain high
. economy grew quickly
. urban pops grew particularly rapidly - 15Stage 3 UK DTM. pop still growing but slower- 47mil 1941
. birth control improved, BR fell
. DR continued to fall (except WW1) as food supply, medicine and hygiene improved - 16Stage 4 UK DTM. pop growth slowed- 56mil 1981
. DR low except WW2
. BR low, except baby booms after WW2 in 1960s - 17Stage 5 UK DTM (today+). DR and BR today almost same and pop is ageing- pensioners outnumber children (by 2030, 1/4 pop could be over 65)
. pop could begin to decline if BR drops below DR because too few youths, or DR becomes larger than BR due to large pop of elderly - 18Why is the DTM useful?. generalised picture of how pop change over time
. easy to compare countries with DTM
. forecast how pop may change- help governments decide policies - 19Limitations of DTM?. original data create DTM was from more developed, richer countries, may not be valid worldwide
. original DTM didn't have stage 5- added as countries moved out of stage 4
. DTM doesn't take things e.g. education and role of women into account and these affect BR a lot e.g. higher education means people delay having family - 20More limitations of the DTM?. pops in countries with different customs may change in dif ways e.g. catholic church condemns contraception
. extreme poverty + low levels development may cause lack of pop growth and prevent LEDCs passing through all stages
. DTM can't predict exactly when country reach stage, or how long it'll last
. doesn't consider migration - 21What are other factors that affect the DTM?. Population control policies
. infectious diseases
. civil wars - 22How population control policies affect the DTM?. high levels of pop growth or decline forced some govs to introduce pop policies
. e.g. France pop is very low, so gov introduced things like subsidised child care to encourage larger families
. e.g. in China pop is too large, gov tried to reduce BR using the one-child policy - 23How infectious diseases affect the DTM?. some countries high levels infectious diseases, keeping DR high, reducing pop or stalling pop growth
. e.g. some African countries like Nigeria and Botswana very high HIV/AIDS rates leading to high DR - 24How civil war can affect the DTM?. increased DR and decreased BR, especially if large numbers of men and women of reproductive age killed
. civil war often leads to emigration decreasing pop, people flee from fighting
. e,g, thousands people died during civil war in Sierra Leone (1991-2002) and thousands more fled to neighbouring countries - 25What is population structure?. number/ % males and females in different age groups within population
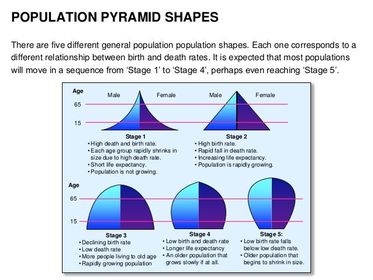
. population pyramids (age-sex) show the population structure - 26—stages of the DTM as population pyramids show how the population structure changes as a country becomes more developed
- 27How can internal migration affect the population structure?. from rural areas to urban areas often affects number of young adults (working and reproductive age)
. move away from countryside into cities to find jobs
. rural-urban migration
. can affect BR as migrants of reproductive age - 28How can emigration away from countries affect countries later stages of DTM?. emigrating at later DTM stages into other countries decrease population of country left
. e.g. elderly people in UK retiring and emigrating to other countries
. reduces number of elderly in UK, but increases number of countries they move to - 29How can immigration into countries at later DTM stages affect counties?. to MEDCs from LEDCs increases population of people of working and reproductive age
, increases BR and population of young people - 30Push and pull factors?. push- negative factors e.g. lack of jobs, poor living conditions and services, fear of political persecution
. pull- positive factors e.g. better jobs, more job opportunities, better living conditions and services - 31How is migration affected by obstacles and opportunities?. obstacles- things that make migration more difficult e.g. cost of moving
. opportunities- opportunities individuals encounter mean they stop before reach intended destination e.g. Polish migrants heading for Ireland for work may stop in London as plenty of jobs - 32What is the dependence ratio and how to work it out?. proportion of the population that has to be supported by the working population (15-64)
. young people (0-14)+old people(over 65)
------------------------------------------
working ages population (15-64) - 33What does a high dependency ration indicate?. greater proportion of dependent people
. e.g. Uganda has high dependency ratio of 1.1 - 34Social impacts of an ageing population. increased pressure on public services- hospitals, hospices, more to care for elderly so more nurses, people act as unpaid careers putting social and financial pressure
. unequal distribution of older people- e.g. Eastbourne UK resort with high prop of retired older people, inadequate facilities for youths e.g. bars and youth vlubs - 35More social impacts of ageing population. reduced pop growth/pop decline- working pop may have fewer children because already have older dependants, reduction BR
. longer working life- state pension low so many retired, often not enough to support people in retirement so some work beyond retirement age- build up personal pensions/savings, or add to state pension - 36Economic impacts of an ageing population. reduced work force- smaller prop of pop working, slow econ growth
. increased taxes- pensions and services paid for by taxes, greater prop of older people claiming pensions and support could mean high taxes for working people
. spending- elderly have saving and pensions to spend (grey pound) - 37Social impacts of a youthful population. increased pressure on public services- greater demand for services such as schools and childcare
. rapid population growth- larger number of children grow up and have families also, increasing pop, may lead to overpopulation if aren't enough services to cope with number of peope - 38Economic impacts of a youthful population. too few jobs- aren;t enough jobs when youths when they grow up, more unemployment means more dependency on government support
. increased poverty- more youths born into families which are already poor, more poor people, some have to work to support family so can't go to school, which means can't break out of poverty - 39Political impacts of ageing population. elderly issues more important to voters
. e.g. changes to national pensions or heating allowances
. immigration laws may be relaxed to allow people of working age into the country - 40Political impacts of youthful population. youth issues will be more important
. e.g. student loans and child care provision
. government may need to increase teacher salaries to encourage more people into the profession - 41Strategies to manage ageing populations. encourage larger families- e.g. Swedish gov makes having children more manageable by giving both parents 18month paid leave. Encouraging larger families result in larger working pop when children grow, provide more taxes and better pensions and services
- 42Strategies to manage ageing populations. raising retirement age- working population made larger, so more contribute to state pension fund and personal pensions for longer
, people also claim state pensions for less time - 43Strategies to manage ageing populations. encouraging immigration of working-aged people- e.g. recent year Japan increased number of foreign workers as aren't enough working-aged Japanese to fill jobs available
. increases working-age population, helping support ageing population by paying taxes - 44Strategies to manage ageing populations. increasing health care provisions- large numbers older people puts pressure on health care systems
. doesn't manage population change but could help ease problem of poor health in elderly - 45Strategies to manage youthful population. controlling BR- some countries overpopulated try slow growth by limiting number children couples can have
. e.g. China's one-child policy in 1979
. prevented 300million births - 46Strategies to manage youthful population. limiting immigration of youths- of reproductive age (15-44) means BR aren;t made higher by immigrants having children
- 47Strategies to manage youthful population. encouraging family planning and contraception- governments offer sex education and free contraception, allowing couples to plan and limit number of children
- 48Strategies to manage youthful population. increasing childcare provision- countries can invest in more and better childcare so parents work instead of caring for children
. doesn't manage population change, but helps address some problems caused by younger population - 49What management strategies aren't sustainable?. encouraging larger families- even larger pop needing services etc, isn't sustainable unless pop needs met in sustainable way e.g. carbon neutral homes, low emission trans
. encouraging immigration of working-aged- e.g. more people require jobs, could be in heavily polluting industries, offices using electricity, unless met in sustainable way it isn't sustainable - 50Inner city characteristics. housing- high density, built in C19, high-rise blocks flats 1960s, old warehouses into new luxury apartments
. ethnicity- high prop of ethnic minorities
. age structure- high prop youths
. wealth- wealthy in redeveloped areas, poorest of urban pop live here
. employment- high prop students, unemployed, unskilled
. services- close to city centre so services, but is usually area of urban decay - 51Suburbs characteristics. housing- mix C20 detached/semidetached with gardens, closer to inner city higher prop houses council owned, further out privately owned gardens and driveways
. ethnicity- less minorities
. age structure- families with children
. wealth- increasing out of city
. employment- mainly tertiary sector and skilled manual workers
. services- local shopping parades, good transport to city centre and public trans - 52Rural/urban fringe characteristics. housing- low density, high quality private housing
. ethnicity- low prop of ethnic minorities
. age structure- mostly families with children, more elderly people
. wealth- increases
. employment- proportion employed in tertiary sector tends to increase
. services- location out town shopping complexes, airports & recreational facilities such as golf courses - 53Rural area characteristics. housing- larger, privately owned housing and new estates (privately owned)
. ethnicity- majority white
. age structure- higher prop of elderly people
. wealth- wealthiest residents who've moved out city, also some less wealthy original rural residents
. employment- high prop of workers professional and e.g. doctors
. services- village shops closed as more residents shop urban areas commuting to work, lack of public transport - 54Environmental factors which affect welfare of people living in each zone?. old, poor qual housing creates poor living environ inner city
. graffiti, vandalism levels highest inner city many empty derelict buildings, also high in suburbs with lots teenagers and children
. air pollution highest inner city due to industrial sites and high vol traffic - 55Social factors which affect welfare of people living in each zone?. tension between different ethnic minorities inner city high prop of ethnic minorities
. crime rate high inner city- high levels unemployment and poverty, often poor relationships between police and community, crime rates fall away inner city
. rural areas also experience social probs e.g. lack public transport services isolate people (elderly) and out-migration lead closure services like shops and post offices - 56Economic factors which affect welfare of people living in each zone?. industrial decline and lack investment lead high levels unemployment in inner city, although employment levels higher further move away there's also increasing unemployment rural areas due to agriculture decline
. poverty highest inner city, lead to higher DR and poorer health due to poor nutrition, education and lack access to services - 57How population change and migration affected housing in urban and rural areas. developed countries most migrants occupy cheap, run down areas of housing urban areas such as inner city
. in developing countries rural-urban migration resulted in shanty towns- limited services e.g. clean water and power - 58How population change and migration affected ethnicity in urban and rural areas. high numbers immigrants change character of an area bringing existing culture and customs, if fail to integrate existing communities= ghettos form, segregated
. some move rural for agriculture, greater impact on character small rural villages than large city, especially from one country e.g. Polish to UK countryside open Polish shops and cafes in small villages - 59How population change and migration affected age structure in urban and rural areas. developed countries, rural areas increasing ageing pops due to out-migration of youths and in-ward migration of elderly
. services affected by change in age structure. e.g. rural areas schools may close due to reduced demand, while increased demand for elderly services e.g. nursing homes - 60How population change and migration affected wealth in urban and rural areas. developed countries increasing numbers secondary home owners and commuters increases wealth of rural area, lead to rising house prices, force youths leave as can't afford
. young wealthy pros move to redeveloped urban areas, increasing wealth there, this can improve inner cities, also mean young originals can't afford houses here - 61How population change and migration affected employment in urban and rural areas. unemployment increase if many move urban areas without jobs available
. big problem for developing countries as often high rate rural-urban migration for work
. rural areas, large number people moving away for work could eventually lead lack of available workers - 62How population change and migration affected services in urban and rural areas. shops + services rural areas suffer due to residents who commute use shops closer to work, bus routes may close as newer residents use cars, could be problem for original residents of rural as rely public trans
. reproductive age move to area, increasing need for childcare and schools, when elderly people move to area increases need for carers, home help and health care
Informationen
- Beschreibung
- A Levels Geography (Sections ) Karteikarten am Population Change, erstellt von Alice Kimpton am 11/03/2016.
- Erstellt von
- Alice Kimpton
- Aufrufe
- 1
- Bewertung