
Flussdiagramm
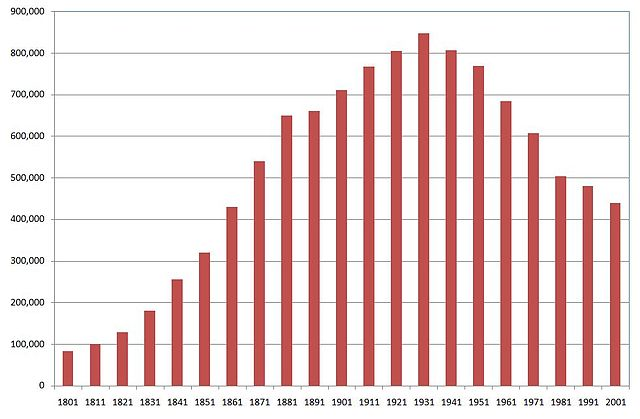
Liverpool population
Inhalt des Flussdiagramms
1. Mass rural-urban migration across the UK with the industrial revolution. Plus falling death rates due to improved medical knowledge
!
2. Deindustrialisation, a significant decline and the clearing of areas of slum housing.
2.
3. After 2001 we see an increase once again in population. Immigration driven in-part by investment, plus ever-increasing student numbers
3.
Informationen
- Beschreibung
- GCSE Geography Flussdiagramm am Liverpool population, erstellt von Iza Keen am 26/01/2020.
- Erstellt von
- Iza Keen
- Aufrufe
- 0
- Bewertung