
Mindmap
Statistics
Inhalt der Mindmap
Statistics
Population / population parameters
- Standard Error
- Standard error from population
- population Mean
- population variance
- population Stand Dev
- Standard Error
Samples / Point Estimates
- use sample statistic to estimate the population parameters. Point estimates - single value that approximates the true value of a population parameter
- Mean x
- Variance
- Stand Dev S
- Hypothesis tests
- Statistical hypothesis is a claim about a population parameter and determines what we actually test
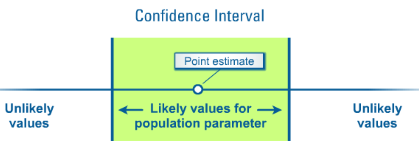
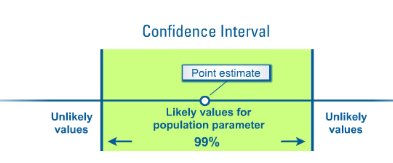
- confidence interval
- A range of likely values for a population parameter. Using CI we can say: it is likely that the population parameter is somewhere within this range.
- confidence level 99%
- how sure we are that confidence interval containts the actual population parameters
- confidence level 95%
- confidence level 90%
- practice
- compare to samples
- compare sample to industry std.
- Null H0
- Population parameter equals a specified value or equals parameter from another population
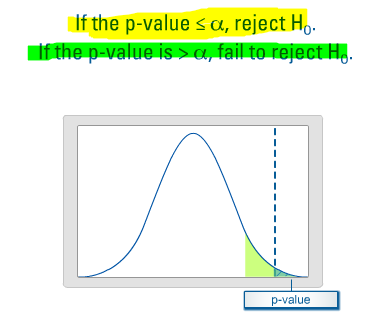
- p-value t-value
- NULL = FALSE significant difference
- rejection = significant evidence of difference between mean from sample and population mean
- reject null hypothesis
- if we reject our results are statistically significant
- (NULL true) type 1 error
- if null hypothesis is true and we reject it: type 1 error
- probability = alpha
- reducing alpha increasing beta
- NULL false: correct decision
- Power (1 - Beta)
- sample size
- sample increases, power increases. sample + ...... power +
- population differences
- as the population diffrences decreases, power decreases as well
- variability
- As variability increases, power decreases
- level Alpha
- common 0.05 level mean that we are willing to accept a 5% chance that we incorrectly rejected the null hypothesis if alpha is set higher we are more likely to correctly reject the null hypothesis if alpha has smoller value is easier to see difference between sample mean and population mean
- sample size
- Power (1 - Beta)
- NULL = TRUE no difference evidence
- there is no evidence for difference between sample mean and population mean
- fail to reject the null hypothesis
- it concludes that we have not enough evidence to claim that alternative hypothesis is true
- type 2 error
- if null hypothesis is false and we fail to reject it: type 2 error
- probability = Beta
- increasing beta reducing alpha
- NULL true : correct decision
- NULL = FALSE significant difference
- Alternative H1
- Population parameter does not equal specified value
- making decision
- 1-sample t-test
- determine whether the population mean is equal to a hypothesized value
- Numeric data
- Random Data
- hypothesed value = population mean
- procedure
- determine null
- the null hypothesis is that the hyphotesiszed value is equal to population mean
- determine alternative
- alternative is the opposite null
- collect sample from population
- sample mean
- sample standard deviation
- Graph
- graph to take a sense of variability and information about the mean
- individual value plot
- interpret
- p-value
- T-value
- alpha level
- determine null
- 1-sample t-test
- 2 variance test
- Numeric Data
- Random Data
- comparing two populations
- procedure
- determine NULL
- null hypothesis state that two populations have the same variability
- determine alternative
- there is not the same variance between two populations
- colect sample 2 population
- data continious
- cmes from 2 independet samples
- randomly taken
- graph data
- interpret test
- Bonett
- Leven
- determine NULL
- 2 sample t-test
- procedure
- termine NULL
- determiane alternative
- collect samples
- Normally distributed
- randomly taken
- taken from 2 populations
- ndependent samples
- potentially unequal variationces
- probalility plot ?
- graph the data
- two individual value plot
- conduct test, interpret data
- p-value
- procedure
- Paired t-test
- procedure
- NULL hypothesis
- the population means are equal
- alternative hypothe
- the population means are not equal
- collect paired samples
- Probability test required?
- do we need to prove probability ? Are we sure that data are with normal distribution?
- dependent sample
- numeric
- random sample
- normally distributed
- Probability test required?
- graph the data
- Individual value plot (values are substracted between both samples. We plot differences !
- conduct test interpretation
- checking p-value, t-value and confidence interval. how calculated mean relate to confidence interval?
- NULL hypothesis
- procedure
Normal Distribution
- 1Sigma
- 2 sigma
- 3 sigma
- Estimated Standard Error
- calculate sampling deviation
- Z-score
- calculate sigma level
- t-disctribution
- t-distribution applied to sampling and used only for normal distribution data
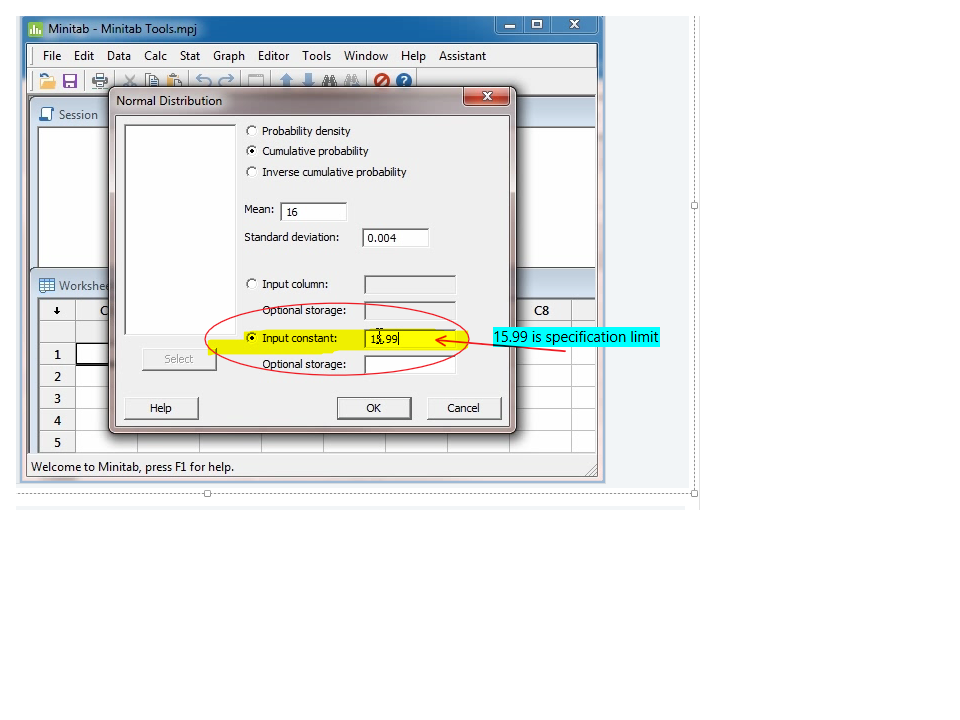
- Cumulative probability
- cumulative probability for a single observation
Descriptive Statistics
- Bar Chart
- Compare categorical data, display counts of several categories, shows the frequency of each categories, easy to spot differences between two or more groups in count,
- Pareto Chart
- Produced to identify the largest opportunities for improvements
- Pie Chart
- Shows relation of parts to a whole, shows differences in percentage between categories in group or groups, (proportions of each categories relative to the whole),
- Histogram
- Shows the distribution of the data set, shape of the distribution, symmetricity, numerate to large number of displayed data
- Dotplot
- Dotplot, displays dot for each data value in the bin, useful for small set of numeric data, we can see how the data is clustered (density in the bin), and shows the outliers
- Individual Value Plot
- Displays individual variables for single group or groups of variables, (for example data for two production lines) The individual value plot is graph with one dot representing each individual value.
- Boxplot
- Help to see larger patterns in the set distribution, Summarize the distribution of data, Shows distribution of data, can be used to compare distribution of two groups (for example morning and evening shifts)
- Time Series Plot
- Shows patterns over time, (increasing or decreasing variation over time), time related questions about variable, change in the process in the time scale or change in the data collection, variation over time is consistent?,
- Bar Chart
Bilder und Dateien der Mindmap
Informationen
- Beschreibung
- Statistics for six sigma
- Erstellt von
- Raf Jablonsky
- Aufrufe
- 45
- Tags
- Bewertung