
Mindmap
Finance
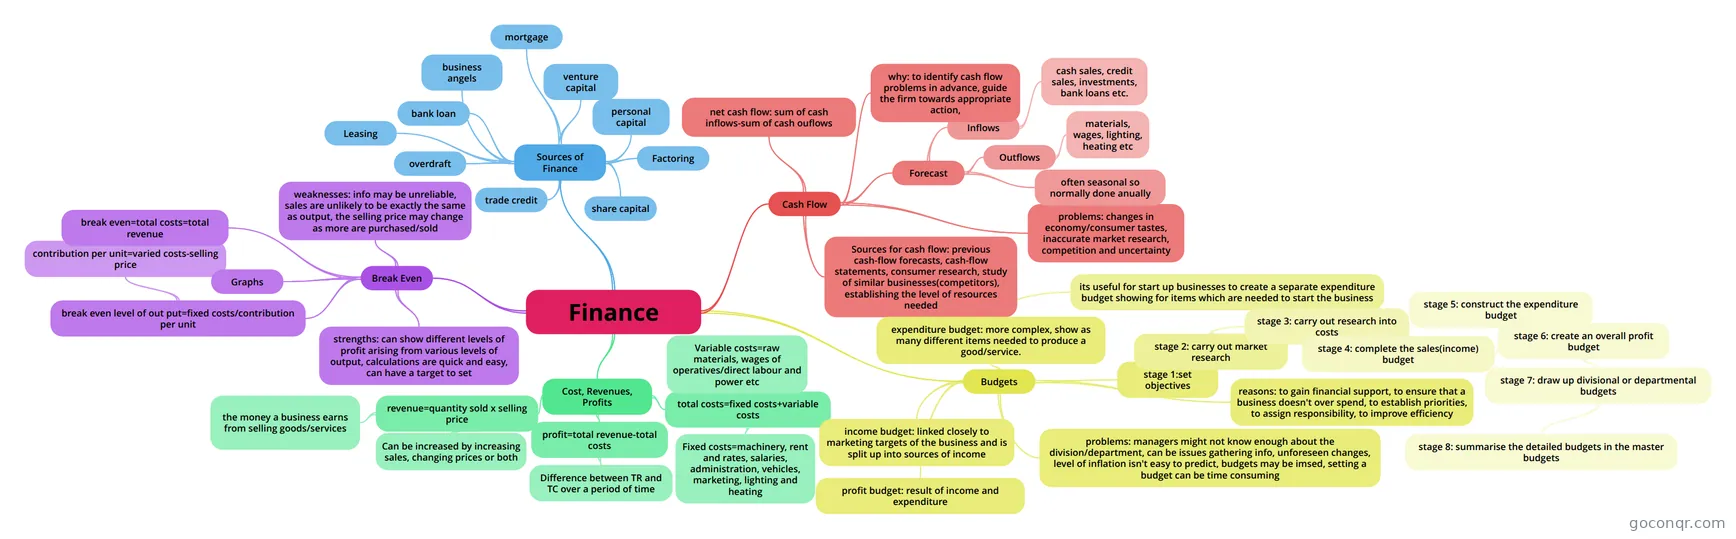
Mind map: Finance
Inhalt der Mindmap
Finance
Break Even
- break even level of out put=fixed costs/contribution per unit
- contribution per unit=varied costs-selling price
- break even=total costs=total revenue
- Graphs
- strengths: can show different levels of profit arising from various levels of output, calculations are quick and easy, can have a target to set
- weaknesses: info may be unreliable, sales are unlikely to be exactly the same as output, the selling price may change as more are purchased/sold
- break even level of out put=fixed costs/contribution per unit
Cash Flow
- Forecast
- Inflows
- cash sales, credit sales, investments, bank loans etc.
- Outflows
- materials, wages, lighting, heating etc
- often seasonal so normally done anually
- Inflows
- Sources for cash flow: previous cash-flow forecasts, cash-flow statements, consumer research, study of similar businesses(competitors), establishing the level of resources needed
- why: to identify cash flow problems in advance, guide the firm towards appropriate action,
- net cash flow: sum of cash inflows-sum of cash ouflows
- problems: changes in economy/consumer tastes, inaccurate market research, competition and uncertainty
- Forecast
Cost, Revenues, Profits
- total costs=fixed costs+variable costs
- Fixed costs=machinery, rent and rates, salaries, administration, vehicles, marketing, lighting and heating
- Variable costs=raw materials, wages of operatives/direct labour and power etc
- revenue=quantity sold x selling price
- Can be increased by increasing sales, changing prices or both
- the money a business earns from selling goods/services
- profit=total revenue-total costs
- Difference between TR and TC over a period of time
- total costs=fixed costs+variable costs
Sources of Finance
- bank loan
- overdraft
- business angels
- mortgage
- venture capital
- personal capital
- share capital
- trade credit
- Factoring
- Leasing
Budgets
- income budget: linked closely to marketing targets of the business and is split up into sources of income
- expenditure budget: more complex, show as many different items needed to produce a good/service.
- its useful for start up businesses to create a separate expenditure budget showing for items which are needed to start the business
- profit budget: result of income and expenditure
- stage 1:set objectives
- stage 2: carry out market research
- stage 3: carry out research into costs
- stage 4: complete the sales(income) budget
- stage 5: construct the expenditure budget
- stage 6: create an overall profit budget
- stage 7: draw up divisional or departmental budgets
- stage 8: summarise the detailed budgets in the master budgets
- stage 7: draw up divisional or departmental budgets
- stage 6: create an overall profit budget
- stage 5: construct the expenditure budget
- stage 4: complete the sales(income) budget
- stage 3: carry out research into costs
- stage 2: carry out market research
- reasons: to gain financial support, to ensure that a business doesn't over spend, to establish priorities, to assign responsibility, to improve efficiency
- problems: managers might not know enough about the division/department, can be issues gathering info, unforeseen changes, level of inflation isn't easy to predict, budgets may be imsed, setting a budget can be time consuming
Informationen
- Beschreibung
- Mindmap am Finance, erstellt von tashtot am 23/01/2014.
- Erstellt von
- tashtot
- Aufrufe
- 7
- Bewertung