
Mindmap
REPRESENTING DATA
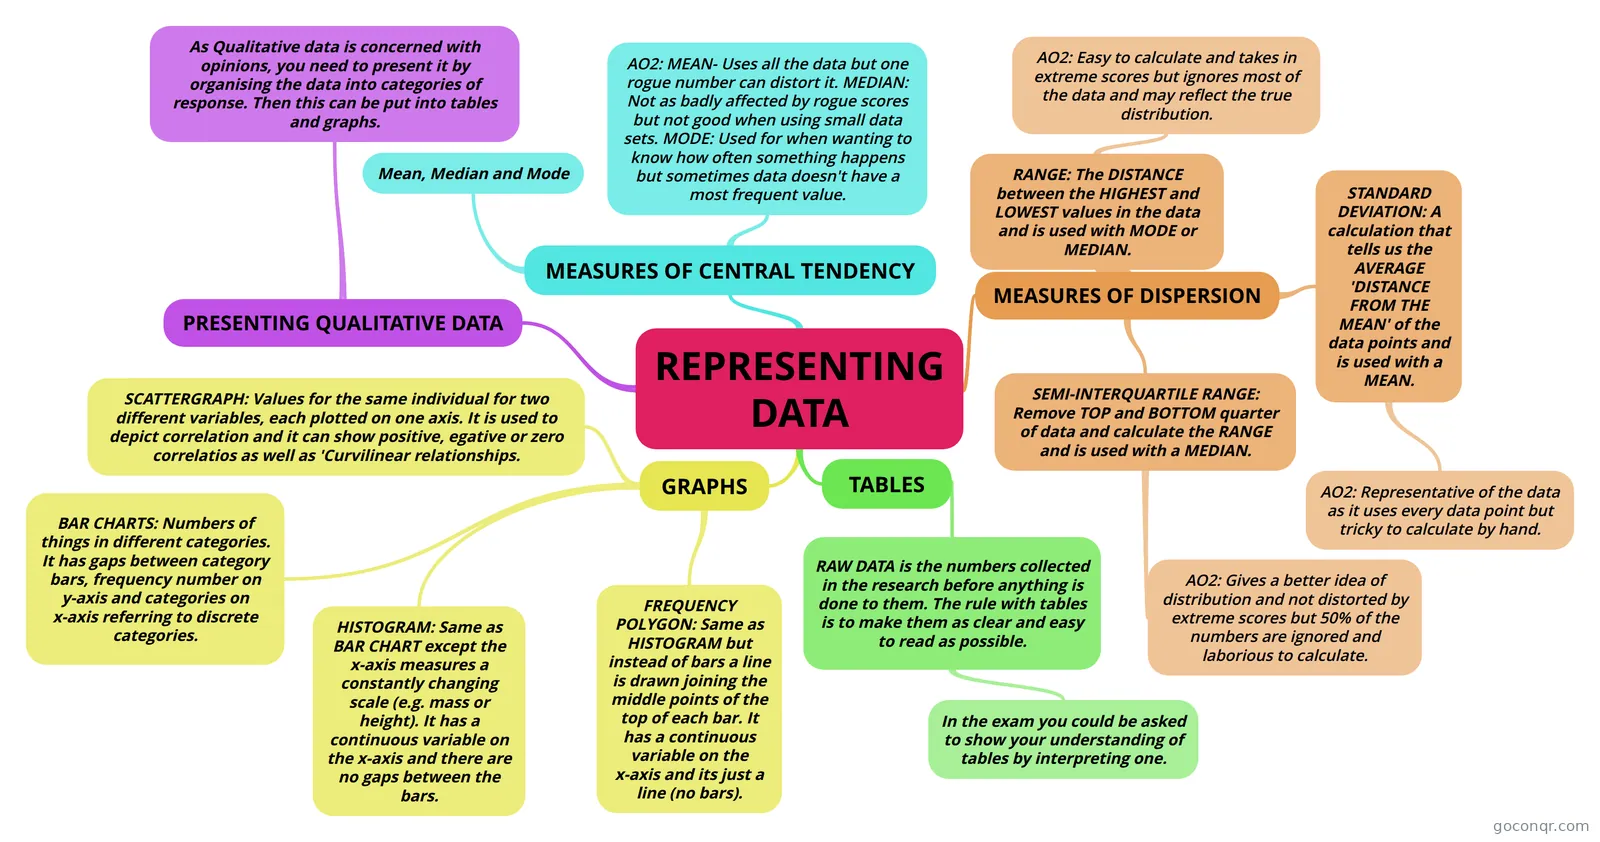
Mind map: representing data in psychology
Inhalt der Mindmap
REPRESENTING DATA
MEASURES OF CENTRAL TENDENCY
- Mean, Median and Mode
- AO2: MEAN- Uses all the data but one rogue number can distort it. MEDIAN: Not as badly affected by rogue scores but not good when using small data sets. MODE: Used for when wanting to know how often something happens but sometimes data doesn't have a most frequent value.
MEASURES OF DISPERSION
- RANGE: The DISTANCE between the HIGHEST and LOWEST values in the data and is used with MODE or MEDIAN.
- AO2: Easy to calculate and takes in extreme scores but ignores most of the data and may reflect the true distribution.
- SEMI-INTERQUARTILE RANGE: Remove TOP and BOTTOM quarter of data and calculate the RANGE and is used with a MEDIAN.
- AO2: Gives a better idea of distribution and not distorted by extreme scores but 50% of the numbers are ignored and laborious to calculate.
- STANDARD DEVIATION: A calculation that tells us the AVERAGE 'DISTANCE FROM THE MEAN' of the data points and is used with a MEAN.
- AO2: Representative of the data as it uses every data point but tricky to calculate by hand.
- RANGE: The DISTANCE between the HIGHEST and LOWEST values in the data and is used with MODE or MEDIAN.
TABLES
- RAW DATA is the numbers collected in the research before anything is done to them. The rule with tables is to make them as clear and easy to read as possible.
- In the exam you could be asked to show your understanding of tables by interpreting one.
- RAW DATA is the numbers collected in the research before anything is done to them. The rule with tables is to make them as clear and easy to read as possible.
GRAPHS
- BAR CHARTS: Numbers of things in different categories. It has gaps between category bars, frequency number on y-axis and categories on x-axis referring to discrete categories.
- HISTOGRAM: Same as BAR CHART except the x-axis measures a constantly changing scale (e.g. mass or height). It has a continuous variable on the x-axis and there are no gaps between the bars.
- FREQUENCY POLYGON: Same as HISTOGRAM but instead of bars a line is drawn joining the middle points of the top of each bar. It has a continuous variable on the x-axis and its just a line (no bars).
- SCATTERGRAPH: Values for the same individual for two different variables, each plotted on one axis. It is used to depict correlation and it can show positive, egative or zero correlatios as well as 'Curvilinear relationships.
PRESENTING QUALITATIVE DATA
- As Qualitative data is concerned with opinions, you need to present it by organising the data into categories of response. Then this can be put into tables and graphs.
Informationen
- Beschreibung
- Unit 1: Research Methods Chapter: Representing Data
- Erstellt von
- pinkizzy
- Aufrufe
- 57
- Tags
- Bewertung