
Notizen
Formulae - Statistics
Inhalt der Notizen (4)
Seite 1
Venn Diagrams
General Rules:
P(A) = probability of even 'A' occurring
P(A`) = probability of 'A compliment' (NOT 'A') occurring = 1 - P(A)
P(AnB) = probability of both 'A' AND 'B' occurring (the intersection)
P(AuB) = probability of either 'A' or 'B' occurring (the union)
Golden Rule:
P(AuB) = P(A) + P(B) - P(AnB)
Special Cases:
Mutually exclusive:
If the events of 'A' and 'B' are separate, they are said to be 'mutually exclusive'
∴ there is no intersection, P(AnB) = 0
Independent Events:
If the events of 'A' and 'B' are independent, they are said to be 'independent events'. This is in the case of flipping a coin and rolling a die; the outcome of one has no bearing on the other.
In this case P(AnB) = P(A) * P(B)
Seite 2
Binomial Distribution
Bernoulli Experiment:
An experiment with only two possible outcomes. These could include:
- True or False
- Heads or Tails
- 4 or not 4 (on a die)
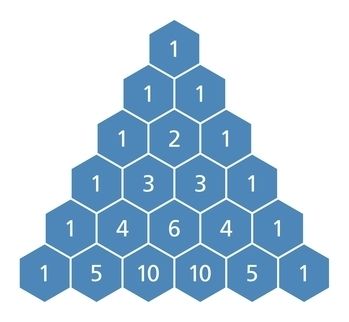
Pascal's Triangle:
This triangle dictates the number of combinations for every possible outcome in a Bernoulli experiment with any given number of trials. An example using the 4th row (1, 3, 3, 1) can be seen below:
"A coin is flipped 3 times:
No. of heads: 0 1 2 3
Combinations: 1 3 3 1 "
Other facts:
- An unknown number in the row below can be found by adding the two numbers above it if they are known (1 + 2 = 3, as seen in rows 3 & 4)
- Each row summates to a power of two (2^0 = 1, 2^1 = 1 + 1 = 2, 2^2 = 1 + 2 + 1 = 4, e.t.c)
- Adding each number in a diagonal line will result in a term from the Fibonacci sequence
Generating the Triangle:
Generating terms from the triangle can be done with the simple expression "nCr", where:
"n" is the number of trials;
"r" is the number of successes required
So, nCr means the number of combinations possible when we want r successes from n trials!
The formula for calculating nCr is as follows:
nCr = n! / r! * (n - r)!
∴ in the case n = 6, r = 4,
nCr = 6! / 4! * (6 - 4)! = 6! / 4! * 2!
= 6*5*4*3*2*1 / (4*3*2*1) * (2*1)
= 6*5 / 2*1 = 30 / 2 = 15
(Remeber: n! is a factor of [n + 1]!)
Using the triangle to find the probability of an event:
In these cases, we define x as the number of successes the trial achieves. We say that x is binomial with n trials and p probability of success, or XnB(n, p)
The probability of an event occurring can be found with nCr using the formula:
P(x = r) = nCr * p^r * q^(n - r), where:
"n" is the number of trials, "r" is the number of required successes;
"p" is the probability of success, and "q" is the probability of failure
This formula can then be used in the cases of P(x = r) and P(x >=/<= r) to find solutions to a binomial problem
Finding the probability of P(x <= r) with the equation:
In order to find the probability of x <= r, we simply repeat "P(x = r) = nCr * p^r * q^(n - r)" for every value that r can be in correspondence to x.
Finding the probability of P(x <= r) with the table:
The binomial distribution table shown gives the probability of every expression of x <= r for most values of n. This is used as a quicker alternative to using the formula.
∴ in the case XnB(20, 0.4),
P(x <= 9) = 0.7553 = 20C0 * 0.4^0 * 0.6^20 + ... + 20C9 * 0.4^9 * 0.6^11
Other notes concerning the table:
P(x < r):
P(x < r) is not available on the tables ∴ P(x <= r - 1) should be found instead when asked in the format
Probabilities greater than 0.5:
Probabilities greater than 0.5 are not given on the tables. This means that a variable "y" must be introduced, where:
"y" is the number of failures
This is stated as YnB(n, q) because the probability of x is less than or equal to r is the same as the probability of y is greater than or equal to r + 1.
∴ P(x <= r) = P(y >= r + 1)
P(x >= r):
The table only shows values for P(x <= r) so we must change P(x >= r) to 1 - P(x <= r) in order to find its probability (this applies to y as well).
P(a <= x <= b):
To find the probability of P(a <= x <= b) we must treat the two inequalities as separate: we have P(x >= a) and P(x <= b);
Then, we convert P(x >= a) to 1 - P(x <= a - 1) so that we can find it in the table;
Finally, because we want the probability of P(a <= x <= b) and not P(a <= x <= n), we do P(x <= b) - P(x <= a - 1). This can be seen with the lists below:
If a = 5, b = 10 & n = 15 then P(x <= b) - P(x <= a - 1) will be the probability of x falling in the bold section:
1 2 3 4 | 5 6 7 8 9 10 | 11 12 13 14 15
c d
"c" represents P(x <= a - 1);
"d" represents P(x <= b)
However, if we wrote 1 - P(x <= a - 1) we would get this:
1 2 3 4 | 5 6 7 8 9 10 11 12 13 14 15 |
c d
"c" represents P(x <= a - 1);
"d" represents P(x = n) = 1
Seite 3
Poisson Distribution
Definition:
This is a special case of a Bernoulli experiment where the number of successes is, in theory, infinite. For this type of trial, we use the mean number of successes to find a probability. This is explained in the example below:
"A coin is flipped 10 times, meaning a maximum of 10 successes can be achieved (this is Binomial). However, if the number of red cars that pass by a building is recorded for an hour, the number of possible successes are effectively infinite (this is Poisson)."
Formula:
Poisson is defined as XnPo(λ), with λ as the mean value;
The Poisson formula is:
P(x=r) = e^-λ * λ^r / r!
Table:
The probability of an inequality (x < 5) can be found using a table, the same as with Binomial. The tables are < tables.
Seite 4
Informationen
- Beschreibung
- A Level Mathematics ((AS) Unit 2: Applied Mathematics) Notiz am Formulae - Statistics, erstellt von Scott Jones am 19/11/2019.
- Erstellt von
- Scott Jones
- Aufrufe
- 3
- Bewertung