
Quiz
Velocity & Acceleration v Time Graphs for Uniform Acceleration
Dieses Quiz enthält Fragetypen, die sich im gewohnten Player öffnen.
Fragen in diesem Quiz (12)
1Over the time frame shown, the cart is:
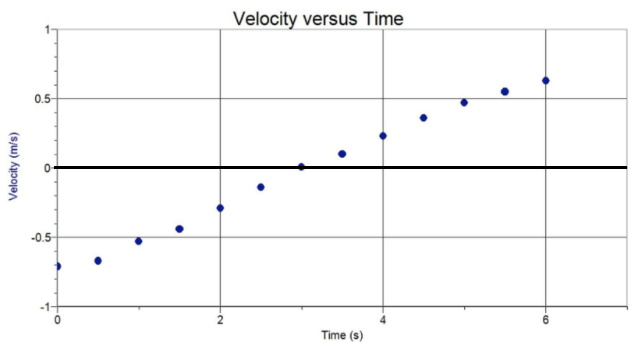
- Acontinually speeding up
- Bmoving at constant velocity
- Cspeeding up, then slowing down
- Dslowing down, then changing direction, then speeding up
2Calculate the slope of the line and determine the appropriate units for the slope. .
Slope = [blank_start]answer[blank_end]- A0.25
3Calculate the area under the curve.
Area = [blank_start]0[blank_end] m- A0
4How would you complete this sentence?
The area under the curve represents the [blank_start]________________[blank_end] of the cart from zero until six seconds.- Adisplacement
5If you were to draw an Acceleration versus Time graph for this motion, which of the following would best describes the slope of your graph?
- Apositive slope
- Bnegative slope
- Czero slope
- Dvariable, as the graph is a parabola
6Calculate the area under your Acceleration versus Time curve.
Area = [blank_start]1.2[blank_end] m/s- A1.2
7A biker is moving along a straight road as shown.
The three graphs represent the motion of the biker during three training exercises, A, B, and C.
Rank the magnitude of the instantaneous acceleration of the biker at the time indicated by the points on the graphs.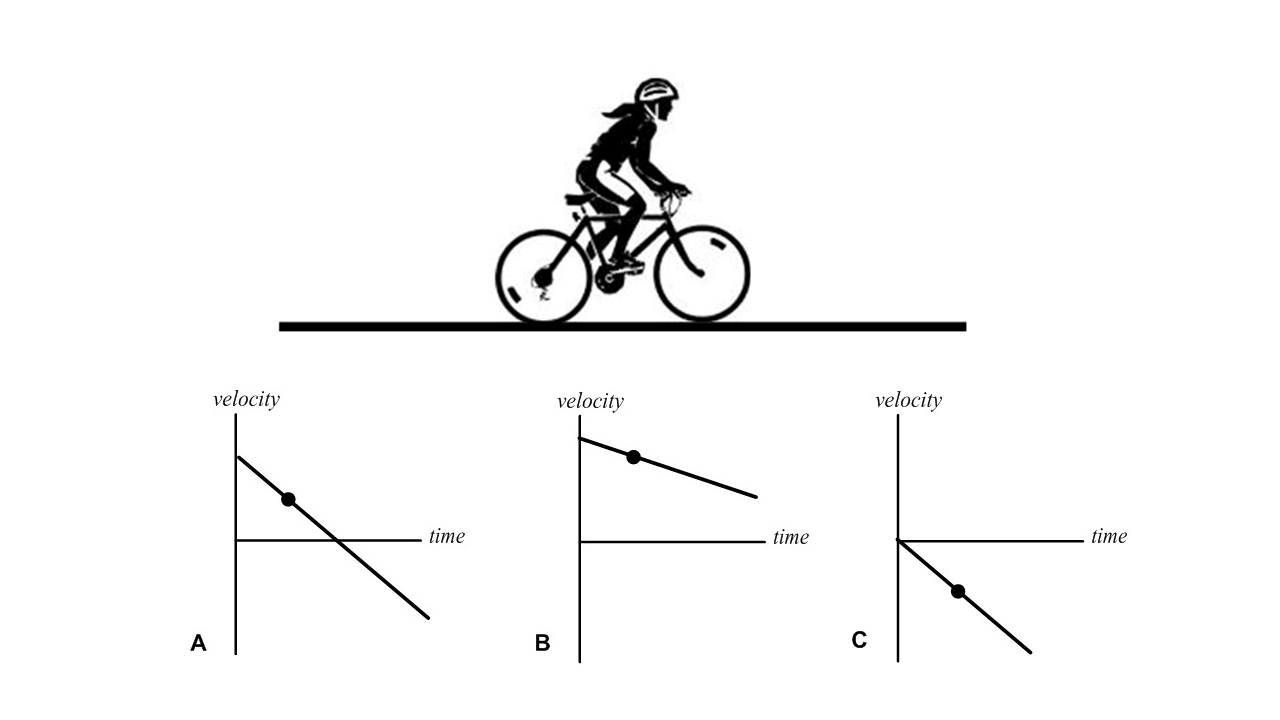
- AB>A=C
- BB>A>C
- CA>B>C
- DA=C>B
8A galloping horse has a speed of 12 m/s at t = 0. After 50 s its speed is 8 m/s.
Draw a Velocity-Time graph on your own paper to represent the motion of the horse and use the graph to answer the following two questions. Assume that the acceleration of the horse is uniform.
Use your graph to calculate the displacement of the horse.
- A100 m
- B200 m
- C400 m
- D500 m
9A galloping horse has a speed of 12 m/s at t = 0. After 50 s its speed is 8 m/s.
Draw a Velocity-Time graph on your own paper to represent the motion of the horse and use the graph to answer the following two questions. Assume that the acceleration of the horse is uniform.
Use your graph to calculate the average acceleration of the horse.- A– 0.08 m/s^2
- B+ 0.08 m/s^2
- C+ 0.24 m/s^2
- D– 0.24 m/s^2
10The Acceleration versus Time graph below represents the motion of a hockey player.
Use the graph to determine the change in velocity of the player from 2 to 16 s.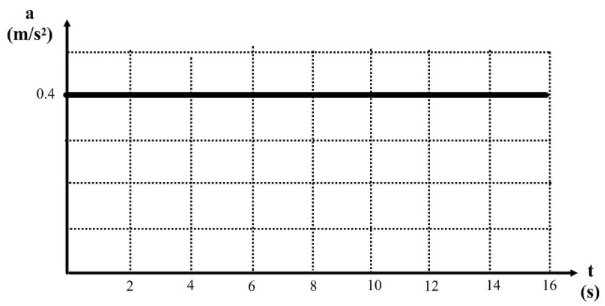
- A0 m/s
- B4.0 m/s
- C5.6 m/s
- D6.4 m/s
11A tennis ball is thrown up in the air and caught on the way down. A student draws the two graphs (A and B) that show the Velocity versus Time of the motion of the ball. Which graph shows the greater magnitude of the displacement of the ball?
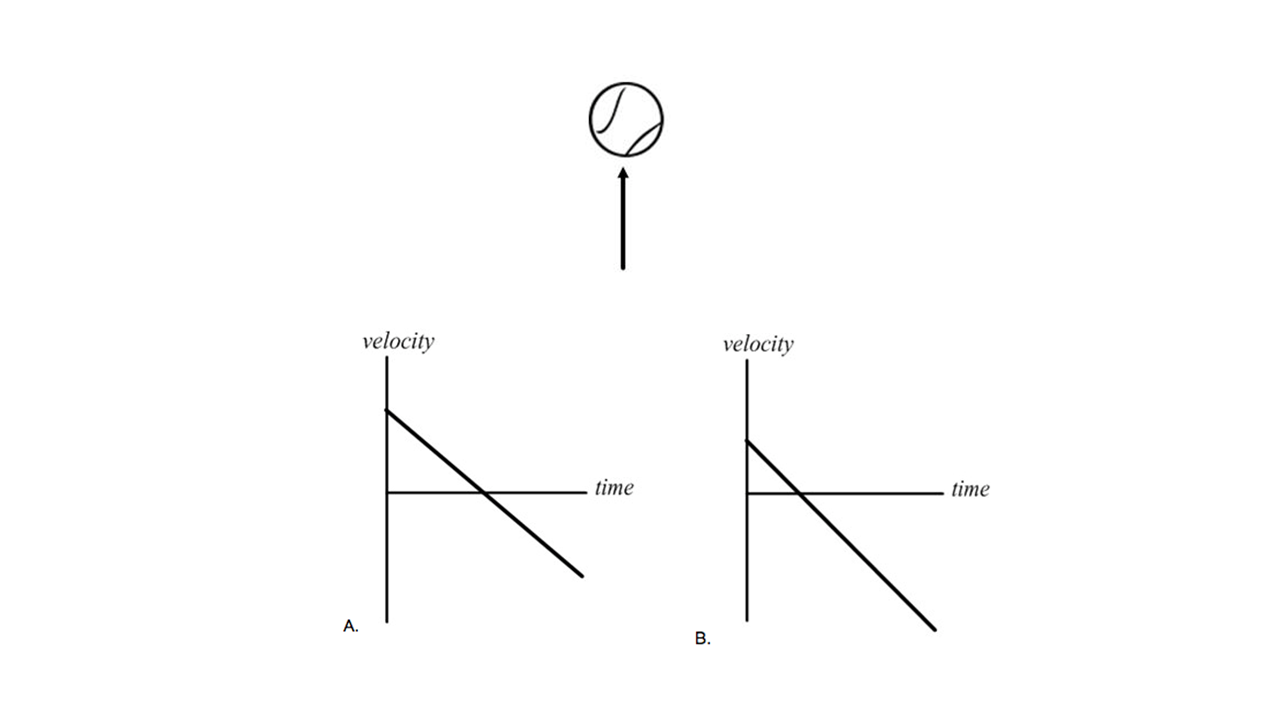
- AGraph B shows greater magnitude of displacement than Graph A
- BGraph A shows greater magnitude of displacement than Graph B
- CGraphs A and B show the same magnitude of displacement
- DMagnitude of displacement cannot be determined from these graphs
12Is the object speeding up, slowing down, or changing direction at each of the following times?
At t=1s, the object is [blank_start]correct[blank_end]
At t=3s, the object is [blank_start]correct[blank_end]
At t=5.5s, the object is [blank_start]correct[blank_end]- Aslowing down
- Bspeeding up
- Cchanging direction
- Dslowing down
- Espeeding up
- Fchanging direction
- Gslowing down
- Hspeeding up
- Ichanging direction
Informationen
- Beschreibung
- Quiz on velocity-time and acceleration-time graphs for uniform acceleration.
- Autor
- Jeffrey Piggott
- Sprache
- English
- Aufrufe
- 662
- Schlagwörter
- Bewertung
- Noch keine Bewertungen Bewerte dieses Quiz