7694541
Beschreibung

Quiz von Ben Armstrong, aktualisiert more than 1 year ago
|
|
Erstellt von Ben Armstrong
vor etwa 7 Jahre
|
|
Frage 1
Frage
What is the purpose of a one-way ANOVA (between or within groups)? And how is it different to a t-test?
Antworten
-
A one way ANOVA examines the difference between four (or more) levels/groups in one variable, whereas a t-test only examines the difference between three levels/groups in one variable.
-
A one way ANOVA examines the difference between three (or more) levels/groups in one variable, whereas a t-test only examines the difference between two levels/groups in one variable
-
A one way ANOVA examines the difference between three (you can't examine more than three) levels/groups in one variable, whereas a t-test only examines the difference between two levels/groups in one variable.
-
A one way ANOVA examines the difference between two (or more) levels/groups in one variable, whereas a t-test only examines the difference between three levels/groups in one variable.
Frage 2
Frage
In an independent measures ANOVA, how is the variance split in terms of sums of squares? And which sum of squares tells us how much variance is explained by our hypothesis that the three groups are different?
Antworten
-
First you have the residual sum of squares (SSR), which is made up of the model sum of squares (SSM) and the total sum of squares (SST). SSM tells us how much variance is explained by our hypothesis or model.
-
First you have the model sum of squares (SSM), which is made up of the total sum of squares (SST) and the residual sum of squares (SSR). SST tells us how much variance is explained by our hypothesis or model.
-
First you have the total sum of squares (SST), which is made up of the model sum of squares (SSM) and the residual sum of squares (SSR). SSM tells us how much variance is explained by our hypothesis or model.
-
First you have the total sum of squares (SST), which is made up of the model sum of squares (SSM) and the residual sum of squares (SSR). The none of the sum of squares values tell us how much of the variance is explained by our hypothesis.
Frage 3
Frage
In a repeated measures ANOVA how is the variance split in terms of sums of squares? And which sum of squares value tells us how much variance is explained by our hypothesis - that the group will be different in each condition?
Antworten
-
First, total sum of squares (SST) shows the total variation in the data, this is made of the sum of squares for within participant variation (SSW) and the sum of squares for between participant variation (SSB). In the SSB we can further split the variation into the model sum of squares (SSM) and the residual sum of squares (SSR). SSR tells us how much variance is explained by our hypothesis.
-
First, total sum of squares (SST) shows the total variation in the data, this is made of the model sum of squares (SSM) and the residual sum of squares (SSR). SST tells us how much variance is explained by our hypothesis.
-
First, total sum of squares (SST) shows the total variation in the data, this is made of the sum of squares for between participant variation (SSB) and the sum of squares for within participant variation (SSW). SSW tells us how much variance is explained by our hypothesis.
-
First, total sum of squares (SST) shows the total variation in the data, this is made of the sum of squares for between participant variation (SSB) and the sum of squares for within participant variation (SSW). In the SSW we can further split the variation into the model sum of squares (SSM) and the residual sum of squares (SSR). SSM tells us how much variance is explained by our hypothesis.
Frage 4
Frage
Why can't we use the sum of squares to calculate the F ratio in one-way ANOVA?
Antworten
-
Because the sum of squares are influenced by the number of scores summed.
-
Because the sum of squares are influenced by the degrees of freedom but mean squares are not.
-
This is a trick question - we do use the sum of squares, its the mean squares we don't use.
-
Because the sum of squares are influenced by the F ratio.
Frage 5
Frage
In a one way ANOVA, if our F value is more than 1 - what does this mean?
Antworten
-
That our MSR is larger than our MSM. This means that there has been an effect of the variable between the groups/within the group - although we don't know if this is significant.
-
That our MSM is larger than our MSR. This means that there has been an effect of the variable between the groups/within the group - although we don't know if this is significant
-
That our MSM is larger than our MSR. This means that there has been an effect of the variable between the groups/within the group - and we know that this is significant.
-
That our MSM is larger than our MSR. This means that there has not been an effect of the variable between the groups/within the group - although we don't know if this is significant.
Frage 6
Frage
Which of the following is NOT an assumption of an independent samples ANOVA?
Antworten
-
Sphericity
-
Interval level data
-
Normal distribution
-
Homogeneity of variance
Frage 7
Frage
Which of the following is NOT an assumption of a repeated measures ANOVA?
Antworten
-
Interval level data
-
Independence of groups
-
Normal distribution
-
Sphericity
Frage 8
Frage
If the assumption of homogeneity of variance is broken - which test should you use instead?
Antworten
-
Welch
-
Brown-Forsythe
-
Tukey
-
Bonferroni
Frage 9
Frage
If your assumption of sphericity is broken - which part of the output should you read instead?
Antworten
-
Mauchly
-
Levene
-
Lower-bound
-
Greenhouse-Geisser
Frage 10
Frage
Can SPSS calculate an effect size for a one-way ANOVA?
Antworten
-
Yes, but only for repeated measures - you should calculate it yourself for independent measures.
-
Yes, for both
-
Yes, but only for independent measures - you should calculate it yourself for repeated measures.
-
No.
Frage 11
Frage
I’m doing a three-way ANOVA with a 3x3x2 design. What does this tell you?
Antworten
-
That this experiment has 3 levels. Two of them have 3 IVs and one has two.
-
That this experiment has 3 IVs. Three of them have 3 levels.
-
That this experiment has 3 IVs. Two of them have 3 levels and one has two.
-
That this experiment has 2 IVs. Two of them have 3 levels
Frage 12
Frage
What information do we get from a factorial ANOVA?
Antworten
-
We can see the main effects of each DV and how they interact.
-
We can see the main effects of each DV.
-
We can see the main effects of each IV.
-
We can see the main effects of each IV and how they interact.
Frage 13
Frage
Within the variability explained by SSM, how can we further split the variance in an independent measures factorial ANOVA?
Antworten
-
The variance explained by SSM is made up of only the SS for each variable.
-
The variance explained by SSM is made up of the SS for each variable plus the SS for the interactions.
-
The variance explained by SSM is made up of the MS for each variable plus the MS for the interactions.
-
You cannot further split the variance explained by SSM.
Frage 14
Frage
I have two IVs: stats knowledge (SSA) and psychology knowledge (SSB). How do we calculate SSA?
Antworten
-
We collapse across SSB and look only at the scores split by the stats knowledge variable as compared to the participants' means
-
We collapse across SSB and look only at the scores split by the stats knowledge variable as compared to the grand mean.
-
We collapse across SSA and look only at the scores split by the psych knowledge variable as compared to the grand mean.
-
SSA is the same as SSM in this context.
Frage 15
Frage
Following from the previous question. How do I calculate SSAxB? And what does it tell me?
Antworten
-
After calculating SSA and SSB then the remaining variance accounted for by SST is the variance from SSAxB. This is the interaction between the two variables.
-
After calculating SSA and SSB then the remaining variance accounted for by SSM is the variance from SSAxB. This is the interaction between the two variables
-
You do not get SSAxB in independent samples factorial ANOVA.
-
After calculating SSA and SSB then the remaining variance accounted for by SSM is the variance from SSAxB. This is the main effect of the two variables.
Frage 16
Frage
What is an interaction?
Antworten
-
When both DVs have a main effect.
-
When both IVs have a main effect.
-
When the effect of one IV on the DV is dependent on another IV.
-
When the effect of one DV on the IV is dependent on another DV.
Frage 17
Frage
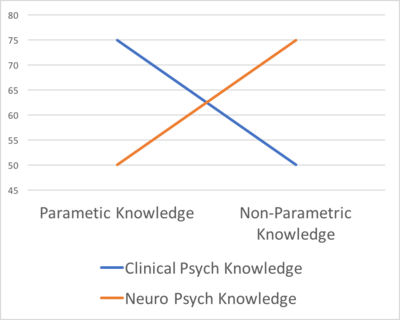
I’ve graphed the interaction between stats knowledge (two levels) and psychology knowledge (two levels) and their effect on a test score. What does this interaction show?
Antworten
-
That participants that had good clinical psychology knowledge scored highly on the test, however, the converse was true for those in the good neuro psychology knowledge group.
-
That participants that had good clinical psychology knowledge and good non-parametric knowledge scored highly on the test, however this did not occur for those with good clinical psychology knowledge and good parametric knowledge. The converse was true for those in the good neuro psychology knowledge group.
-
That participants that had good clinical psychology knowledge and good parametric knowledge scored highly on the test, however this did not occur for those with good clinical psychology knowledge and good non-parametric knowledge. The converse was true for those in the good neuro psychology knowledge group.
-
That participants that had good clinical psychology knowledge and good parametric knowledge scored highly on the test, however this did not occur for those with good clinical psychology knowledge and good non-parametric knowledge. The same was true for those in the good neuro psychology knowledge group.
Frage 18
Frage
If my study is a between subjects design – am I concerned about whether my data breaks the assumption of homogeneity of variance or the assumption of sphericity? And what would I expect to see if this assumption had been met?
Antworten
-
Sphericity - the Mauchly's test should not be significant
-
Sphericity - the Mauchly's test should be significant.
-
Homogeneity of variance - the levene's test should be significant.
-
Homogeneity of variance - the levene's test should not be significant.
Frage 19
Frage
After completing our factorial ANOVA – why do we employ syntax to look at the interaction?
Antworten
-
Because this is the best way to explore the differences between the different levels in an interaction.
-
We don't - multiple comparisons tells us enough.
-
Because we want to examine the differences between the IVs.
-
Trick question - this is only used to examine main effects.
Frage 20
Frage
Why can't we only interpret the F from the SSM line of the output?
Antworten
-
Because we need to know how much variance is explained by the SSR output, which is part of the variance explained by SSM.
-
Because we don't just need to know how much variance is explained by the model but whether each individual variable is a explaining a significant amount of variance.
-
Because we don't just need to know how much variance is explained by the model but whether each individual variable and their interactions is a explaining a significant amount of variance.
-
Trick question - we only interpret the SSM line of output in factorial ANOVA.
Frage 21
Frage
How do we partition the variance for SSM in factorial repeated measures ANOVA?
Antworten
-
We split it into SSA and SSB.
-
We don't split the variance beyond SSM.
-
We split it into SSA and SSAxB.
-
We split it into SSA, SSB and SSAxB.
Frage 22
Frage
How do we partition the variance for SSR in a repeated measures factorial ANOVA?
Antworten
-
Into SSRA and SSRB.
-
We don't partition the variance of SSR.
-
Into SSRA and SSRAxB
-
Into SSRA, SSRB and SSRAxB.
Frage 23
Frage
Which formula do I use to calculate F for one of my main effects?
Antworten
-
MSA/MSR
-
MSA/MSRA
-
MSA/MSB
-
MSA/dfA
Frage 24
Frage
In a repeated measures ANOVA are we concerned with Homogeneity of Variance or Sphericity? And what do we expect to see if the assumption has been met?
Antworten
-
Homogeneity of Variance - Levene's test should be significant
-
Sphericity - Mauchly's test should not be significant
-
Sphericity - Mauchly's test should be significant
-
Homogeneity of Variance - Levene's test should not be significant
Frage 25
Frage
Below is my syntax for a 2 way 3x2 repeated measures ANOVA. IV1 Time of Meal (Breakfast, Lunch and Dinner), IV2 Day (Day1 Day2). I'm missing a section of the syntax - complete it.
GLM BreakfastDay1 BreakfastDay2 LunchDay1 LunchDay2 DinnerDay1 DinnerDay2
/WSFACTOR [COMPLETE THIS LINE]
/EMMEANS = TABLES(PreDuringPost*LeftRight) COMPARE(LeftRight)
Antworten
-
Day 3 TimeMeal 2
-
TimeDay 6
-
TimeMeal 2 Day 3
-
TimeMeal 3 Day 2
Frage 26
Frage
How is an interaction different from a main effect?
Antworten
-
For a main effect: IV 1 will have the same effect on the DV in all levels of IV 2 In an interaction: IV 1 will only effect the DV in specific levels of IV 2
-
Main effects and interactions are the same.
-
For a main effect: DV 1 will have the same effect on the IV in all levels of DV 2 In an interaction: DV 1 will only effect the IV in specific levels of DV 2
-
For a main effect: IV 1 will only effect the DV in specific levels of IV 2
Frage 27
Frage
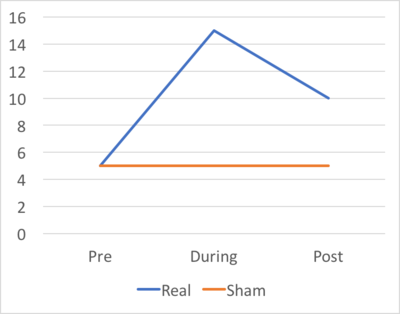
I've conducted an experiment examining real vs sham brain stimulation on a verbal fluency experiment. I've recorded number of words produced to the letter S in one minute at Pre During and Post stimulation. The graph of my results is below. What is this interaction showing?
Antworten
-
Sham stimulation increased performance as compared to Real, but only During stimulation and Post stimulation - there was no difference Pre stimulation.
-
Real stimulation increased performance as compared to Sham, but only Pre stimulation and Post stimulation - there was no difference During stimulation.
-
Real stimulation increased performance as compared to Sham, but only During stimulation and Post stimulation - there was no difference Pre stimulation.
-
There is no interaction between these variables.
Frage 28
Frage
What is a mixed factorial design?
Antworten
-
A design which has 2+ IVs. Both of which is between subjects.
-
A design which has 2+ IVs. At least one of which is between subjects and one within subjects
-
A design which has 3+ IVs. At least one of which is between subjects and one within subjects.
-
A design which has 2+ IVs. Both of which is within subjects
Frage 29
Frage
In a mixed factorial ANOVA are we concerned with Homogeneity of Variance or Sphericity?
Antworten
-
Only Sphericity which applies when the within subjects IV has 3+ levels as with repeated measures designs that are not mixed.
-
Only Sphericity which applies when the within subjects IV has 2+ levels as with repeated measures designs that are not mixed.
-
Both, but Sphericity only applies when the within subjects IV has 3+ levels as with repeated measures designs that are not mixed.
-
Only Homogeneity of Variance.
Frage 30
Frage
In SPSS, what process do we use to complete a mixed factorial ANOVA?
Antworten
-
The same as for repeated measures ANOVA but we add in the between subjects variable at the 'define' stage.
-
The same as for repeated measures ANOVA but we add in the between subjects variable at the 'Post Hoc' stage.
-
Mixed ANOVA uses it's own process which is entirely different from repeated and independent measures ANOVA.
-
The same as for independent measures ANOVA but we add in the between subjects variable at the 'define' stage.
Frage 31
Frage
Assuming the data meet the assumptions of parametric tests, non-parametric tests, compared to their parametric counterparts ___________
Antworten
-
Are more conservative
-
Are less likely to accept the alternative hypothesis
-
Have less statistical power
-
All of the above
Frage 32
Frage
A researcher measured leadership skills in police officers, doctors, and accountants. There were unequal group sizes and the data were skewed. What test should be used to analyse the data?
Antworten
-
Wilcoxon test
-
Kruskal-Wallis test
-
One-way ANOVA
-
Friedman test
Frage 33
Frage
The results of the test used to analyse the data described in Question 32 showed a significant result. How should the researcher carry out post-hoc tests?
Antworten
-
Compare groups using the Mann Whitney test
-
Compare groups using the Wilcoxon test
-
Compare groups using a t-test
-
None of the above. Post-hoc analyses cannot be carried out with non-parametric data
Frage 34
Frage
An advantage of non-parametric statistics is that _________
Antworten
-
You need a computer to calculate them
-
They have many assumptions to meet
-
They are easy to calculate
-
They are very powerful
Frage 35
Frage
Which of the following tests is analogous to a standard within-subjects ANOVA?
Antworten
-
Mann-Whitney
-
Friedman
-
Wilcoxon
-
Kruskal-Wallis
Frage 36
Frage
Tied scores (when two or more scores have the same value) may present a problem in non-parametric tests. The way to deal with them in a Kruskal-Wallis test is to _____________
Antworten
-
Throw out the tied data
-
Assign any tied values the average of the ranks they would have received had they not been tied
-
Use a random number table to assign ranks to the tied values
-
Assign any tied values the lower of the ranks they would have received had they not been tied
Frage 37
Frage
A dataset contains the following values: 23, 28, 37, 23, 45, 49, 37, 62. Rank the values. Which rank is associated with value 37?
Antworten
-
3.5
-
4
-
4.5
-
6
Frage 38
Frage
Researchers wanted to examine whether the ‘see-food’ diet was effective. A group of volunteers were placed on the diet and their weight (in kilograms) was measured at the beginning of the diet, after 1 month, after 2 months, then at the end of the diet after 3 months. The data were not normally distributed. Which test would be appropriate to analyse this data?
Antworten
-
Mann-Whitney
-
Friedman
-
Wilcoxon
-
Kruskal-Wallis
Frage 39
Frage
In a Kruskal-Wallis test, the _________ the value of H, the more likely you are to reject the null hypothesis
Antworten
-
Larger
-
Smaller
-
More negative
-
H is not relevant for the Kruskal-Wallis test
Frage 40
Frage
What assumption does ANCOVA have that ANOVA does not?
Antworten
-
Homogeneity of variance
-
Homoscedasticity
-
Homogeneity of sample size
-
Homogeneity of regression slopes
Frage 41
Frage
ANCOVA is ___________
Antworten
-
Used to correct for unmeasured variables that could affect the outcome variable
-
A method of portioning the results of ANOVAs to investigate where differences between independent variables lie
-
A robust version of ANOVA
-
An extension of ANOVA that partials out the effect of other measured variables
Frage 42
Frage
A researcher conducted a study to examine whether people’s attachment styles are associated with differences in relationship satisfaction. Participants were divided into three groups according to their attachment styles (secure, dismissing, and fearful) and their relationship satisfaction was measured. Depression levels were also measured, as it is known that relationship satisfaction covaries with depression. Which variable should the researcher use as a covariate in the data analysis?
Antworten
-
Attachment style
-
Secure attachment
-
Depression
-
Relationship satisfaction
Frage 43
Frage
Regarding the study described in Question 42, which of the below questions would be relevant to the data analysis?
Antworten
-
Does relationship satisfaction have a significant effect on the relationship between attachment and depression?
-
What would the means of the groups be on relationship satisfaction if their levels of depression were constant?
-
What would the mean relationship satisfaction be if levels of depression were constant?
-
What would the mean depression score be for the three groups of attachment styles if their levels of relationship satisfaction were constant?
Frage 44
Frage
What problem do you foresee with the study described in Question 42?
Antworten
-
There could be more than three groups
-
It is likely that there will be a linear association between depression and relationship satisfaction
-
It is likely that the regression lines will be parallel
-
Depression might also be related to attachment style
Frage 45
Frage
The larger the F statistic, the larger the _____________ compared to the _________
Antworten
-
Variation between groups; variation within groups
-
Variation within groups; variation between groups
-
Variation between groups; total variation
-
Total variation; variation between groups
Frage 46
Frage
A covariate is best described as __________
Antworten
-
A variable that is related to the dependent variable
-
A variable that is directly influenced by the dependent variable
-
A variable that is related to the independent variable
-
A variable that is unrelated to all other variables in the study
Frage 47
Frage
A researcher wanted to see whether giving students caffeine would improve their memory. He gave all students a memory test, then he randomly assigned participants to two groups. One group received a caffeinated drink and the other group received a decaffeinated drink. Both groups then took another memory test (with different questions). The researcher used ANCOVA to analyse the data. Which variable was the covariate?
Antworten
-
Caffeine
-
Score on the first memory test
-
Score on the second memory test
-
There was no covariate
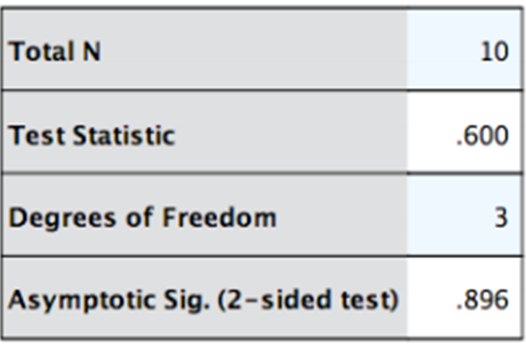
Frage 48
Antworten
-
The weight of participants did not significantly change during the diet, �2 (3) = 0.60, p = .90
-
The weight of participants did not significantly change during the diet, �2 (3) = 0.60, p = .89
-
The weight of participants significantly changed during the diet, �2 (3) = 0.60, p < .05
-
The weight of participants significantly changed during the diet, �2 (3) = 0.60, p > .05
Frage 49
Frage
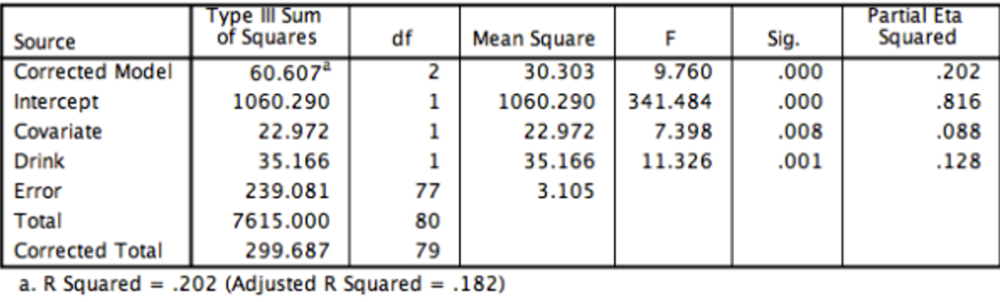
The SPSS output from the ANCOVA is shown below. What is the correct way to report these results?
Image:
Week 8 (image/png)
Antworten
-
There was a significant effect of caffeine on memory after controlling for the effect of the covariate, F (1, 77) = 11.33, p = .001
-
There was no significant effect of caffeine on memory after controlling for the effect of the covariate, F (1, 77) = 11.33, p > .05
-
There was a significant effect of caffeine on memory after controlling for the effect of the covariate, F (1, 77) = 7.40, p = .008
-
There was no significant effect of caffeine on memory after controlling for the effect of the covariate, F (1, 77) = 341.48, p < .001
Frage 50
Frage
What would you use Box’s test for?
Antworten
-
To test for multivariate normality
-
To test for a plausible linear combination of the dependent variables
-
To test for homogeneity of variance
-
To test for homogeneity of covariance matrices
Frage 51
Frage
If your MANOVA is statistically significant:
Antworten
-
You could conduct separate Bonferroni-corrected ANOVAs on each dependent variable
-
There is no added value in performing discriminant function analysis
-
You could conclude that all groups differ significantly
-
None of the answers
Frage 52
Frage
How does MANOVA handle the dependent variables (DVs) in the analysis?
Antworten
-
The DVs are compiled into a linear combination
-
The DVs are entered sequentially into a model
-
The DVs are entered stepwise into an analysis
-
The DVs are standardized and summed
Frage 53
Frage
Which one of these might you consider a violation in MANOVA, suggesting it may be better to use an alternative analysis?
Antworten
-
You have 30 participants per group in your between-participants design
-
You have equal numbers of participants and it is a large sample size
-
You have normally distributed dependent variables and all linear combinations of the dependent variables
-
Box's M has an associated p-value of < 0.05 and you have unequal sample sizes
Frage 54
Frage
The difference between MANOVA and ANOVA is that MANOVA has the ability to handle _______
Antworten
-
Several dependent variables
-
Several independent variables
-
Nonmetric independent variables
-
Data with large error terms
Frage 55
Frage
Which of the following are true of MANOVA?
Antworten
-
Dependent variables are combined into discriminant function variates
-
It involves the computation of F values
-
Calculations are performed on matrices which contain cross-products
-
All of the options
Frage 56
Frage
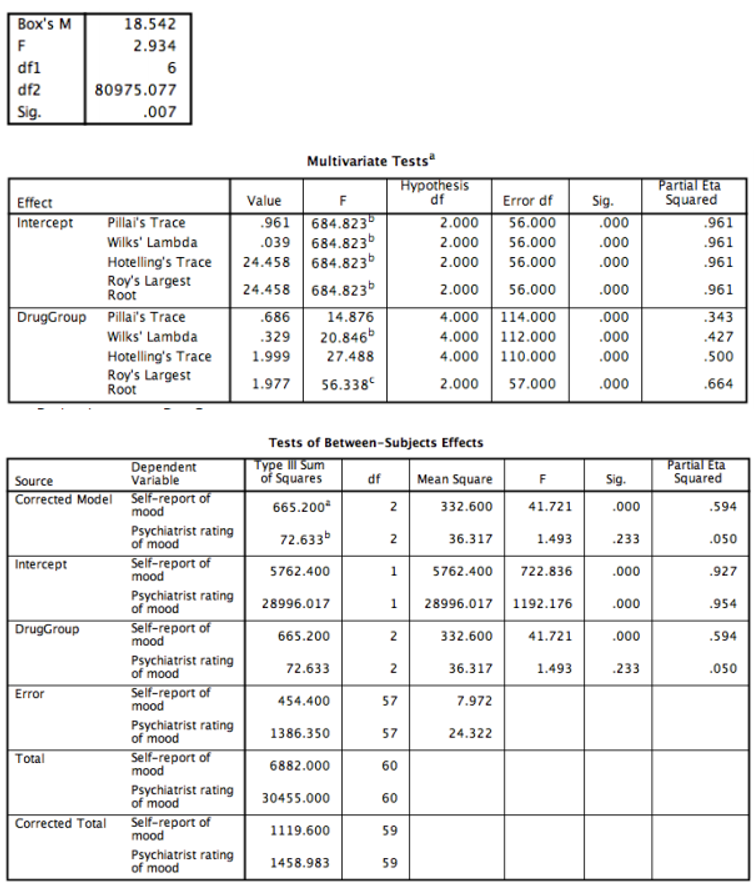
A researcher wanted to examine the effects of a new antidepressant drug. She recruited 60 clinically depressed participants and randomly allocated them to three conditions: no dose (placebo), low dose and medium dose of the drug. She administered the drugs to participants for one month, then measured their mood levels by asking them to complete a self-report mood measure. However, she decided that mood should not just be measured by self-report, so she also asked the participants’ psychiatrists to give their ratings of each person’s mood. All mood ratings were measured on a 1-50 scale, with 1 indicating the lowest possible mood and 50 indicating the highest possible mood. The SPSS output from the data analysis is shown to the left. Are all the assumptions of MANOVA met?
Image:
Week 9 (image/png)
Antworten
-
Yes
-
No, the assumption of equality of covariance matrices is violated
-
No, the assumption of multivariate normality is violated
-
It is not possible to tell from this output
Frage 57
Frage
Which of the following statements about the output shown in the previous question is true?
Antworten
-
There is a significant multivariate difference between the drug groups
-
Significant univariate differences are only present for psychiatrist ratings of mood
-
Self-report ratings of mood are significantly higher than psychiatrist ratings of mood
-
All of the answers are true
Frage 58
Frage
Which of the following might be a problem with the study described two questions ago?
Antworten
-
There may have been individual differences in mood at the beginning of the study
-
There was only one independent variable
-
The dependent variables were measured on different scales
-
All of the answers
Frage 59
Frage
In the study described in Question 56, which test statistic gives the largest effect size for the effect of the drug?
Antworten
-
Pillai’s Trace
-
Wilks’ Lambda
-
Roy’s Largest Root
-
They are all equal
Frage 60
Frage
A dataset contains the following values: 45, 67, 32, 54, 32, 61, 54, 49. Rank the values. Which rank is associated with value 54?
Antworten
-
6
-
5.5
-
4.5
-
4
Frage 61
Frage
A researcher conducted a study to examine whether people’s level of daily exercise is associated with differences in their mood. Participants were divided into three groups according to their exercise level (low, medium, and high) and their mood was measured using a questionnaire. Amount of sleep per night was also measured, as it was thought that mood might also be related to sleep. Which variable could the researcher use as a covariate in the data analysis?
Antworten
-
Sleep
-
Exercise levels
-
Mood
-
All of the answers
Frage 62
Frage
What does 'N' represent in this Kruskal-Wallis equation?
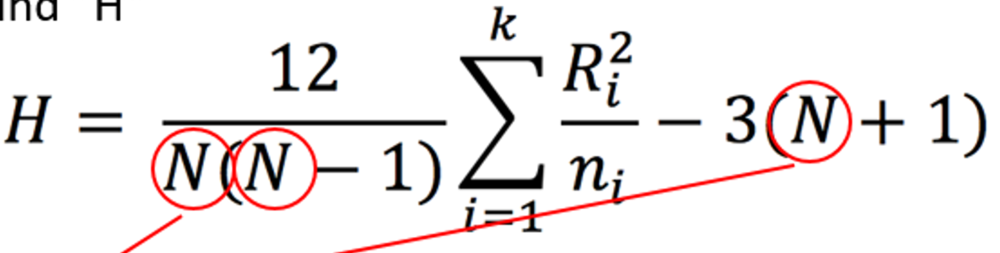
Antworten
-
Sum of ranks
-
Number of conditions
-
Each condition
-
Total number of participants
Frage 63
Frage
How would you write out the interaction for this between-subjects factorial ANOVA?
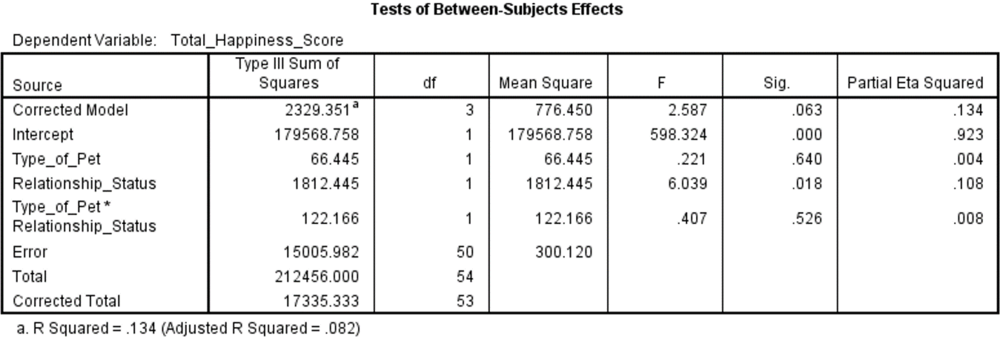
Antworten
-
F(1,50) = .22, p = .64, np2 = .004
-
F(1,50) = 6.04, p = .02, np2 = .11
-
F(1,50) = .41, p = .53, np2 = .008
-
F(1,50) = .41, p = .526, np2 =.008
Frage 64
Frage
What does partial eta squared (η2p) show?
Antworten
-
Partial eta squared (η2p) reflects the proportion of variance that a variable explains that is not explained by other variables in the analysis
-
Means of two groups
-
Statistical power of a test and it's ability to find an effect, if one exists
-
The estimation of the effect size in the population
Frage 65
Frage
Which of the following is NOT true in relation to P-values?
Antworten
-
Does not tell us how important the effect is
-
Arbitrary, but encourages all or nothing thinking
-
Greatly influenced by sample size (as sample increases, the critical value decreases)
-
Is an objective and usually standardised measure of the magnitude of the observed effect
Frage 66
Frage
Which of the following is NOT a cross-product relating to the sums of squares used in univariate ANOVA?
Antworten
-
Total cross-product
-
Cross-product due to the mode
-
Residual cross-product
-
Reverse Product
Möchten Sie mit GoConqr kostenlos Ihre eigenen Quiz erstellen? eigenen Mehr erfahren.