Page 1
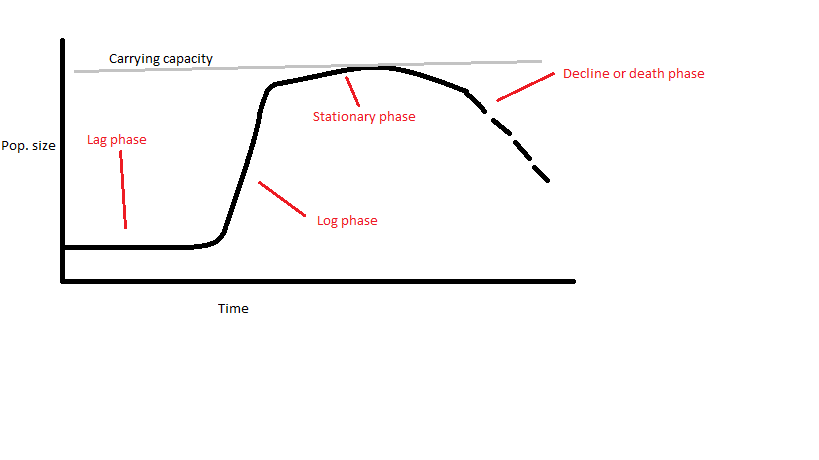
Population size and growth curves Lag phase- Organisms are adjusting to the surrounding conditions. This may mean taking in water, cell expansion etc. The cells are active but not reproducing so population remains fairly constant. Log phase- The population size doubles each generation as every individual has enough space and nutrients to reproduce. In some bacteria, the population can double every 20-30 minutes in these conditions. The length of this phase depends on how quickly the organisms reproduce and take up the available space and nutrients. Stationary phase- Nutrient levels decrease and waste products like carbon dioxide and other metabolites build up. Individual organisms die at the same rate at which new individuals are being produced. Decline/death phase- Nutrient exhaustion and increased levels of toxic waste products and metabolites lead to the death rate increasing above the reproduction rate. Eventually all organisms will die in a closed system.
Want to create your own Notes for free with GoConqr? Learn more.