
Fichas
population notes
Fichas del conjunto (79)
- 1Define: Death rate?the number of deaths per 1000 people in 1 year
- 2Define: Longevity?the increase in life expectancy over a period of time. It is a direct result of improved medical provision and increased levels of economic development
- 3Define fertility?the number of live births per 1000 women aged 15-49 in 1 year. It is also defined as the average number of children each woman in a population will bear. If this number is 2.1 or higher a population will replace itself
- 4Define birth rate?it is expressed as the number of live births per 1000 people in 1 year
- 5Define: Natural change?the change in size of a population caused by the interrelationship between birth and death rates. If birth rates exceeds death rates then a population will increase and vice versa
- 6Define: infant mortality?The number of deaths of children under the age of 1 expressed per 100 live births
- 7Define life expectancy?the average number of years from birth that a person can expect to live for
- 8what is a census?procedure of systematically acquiring and recording information about members of a given population and is regularly occurring.
- 9Census in the ukthey have taken place every ten years since 1801, except 1941. In addition to providing detailed information about the national demographic, results of census play an important part in calculating of the allocation of resources to regional/ local service providers by the governments of both the U.K and the EU.
- 10why do census measure population?An accurate count of the population in each local area helps governments to calculate the size of grants it allocates each local and health authorities. In turn, these authorities use census information when planning services within their areas
- 11why do census measure health?Data on the age and socio-economic makeup of the population and more specifically on general health and long term illness enables the government to plan health and social services and to allocate resources
- 12why do censuses measure housing?information on housing and its occupants measures inadequate accommodation and with informations about the way we live as households indicates the need for new housing
- 13why do censuses measure employment?The census shows how many people work in different occupations and industries throughout the country, helping the government and buisnesses to plan jobs and training policies and to make informed investment decisions
- 14why do census measure transport?informations collected on travel to and from work and on the availiability of cars contributes to the understanding of pressures on transport system and to the planning of roads and public transport
- 15why do censuses measure ethnic and social groups?Data helps to identify the extent and nature of disadvantage in Britain and to measure the success of equal opportunities policies. info helps central/local governments to allocate resources and plan programmes to take account of the needs of the minority
- 16Population Indicators: what is natural change?The change in size of a population caused by the interrelationships between birth and death rates. If birth rate exceeds death rate then a population will increase and vice versa
- 17how is natural change calculated?The rate of natural increase is given as a percentage, calculated by dividing the natural increase by 10. For example, if birth rate is 14 per 1000 population and the death rate is 8 per 1000 population then the natural increase = 14 – 8 = 6. So 6/10 which is equal to 0.6%
- 18population distribution: what is it where are people distributed?population distribution is where people live
world's 7 billion people aren't evenly spread out. Most people live in 1/3 of the land area: 10% is too dry, 5% is to cold, 10% is habitable, 70% is water - 19Population density what is it ? how is it calculated?is the number of people living in a given area (usually expressed per square km)
it is calculated by dividing the total population by the total area.
There are usually clear human and physical factors to explain this pattern - 20Human development index what is it?the Human development index is a summary measure of average achievement in key dimensions of human development: a long and healthy life, being knowledgeable and have a decent standard of living.
- 21The HDI is the mean of indices for each of the three dimensions what are these three dimensions?Health includes life expectancy
education includes mean years of schooling
standard of living includes gross national income per capita - 22Population Change: Causes of population growth health?the control of disease, birth control measures, infant mortality rate, diet and malnutrition, the numbers of doctors and nurses, sexual health, sanitation
- 23Population Change: Causes of population growth education?Health education, the age at which compulsory schooling finnishses, females in education, levels of tertiary education, literacy levels
- 24Population Change: Causes of population growth social provisions?levels of care for the elderly, availiability of radio and other forms of media, clean water supply
- 25Population Change: Causes of population growth cultural factorsreligious attitudes to birht control, status gained from having children, the role of women in society, sexual morality
- 26Population Change: Causes of population growth political factors?taxation to support services, strength of the economy, impact of war and conflicts access to healthcare and contraception
- 27Population Change: Causes of population growth environmental factors?frequency of hazardous environmental conditions that breed disease
- 28Changes in population characteristics: fertility?in most parts of the world fertility exceeds both morality and migration. It is therefore the main determinant of population growth
- 29Changes in population characteristics: death rate?Subsaharan Africa have high birth rates counter high rates of infant mortality. In contrast Europe average falls short of two children. Improve in healthcare, sanitation, diet led to a drop in rates of child mortality, reduce the need of large families as forms of society for the future
- 30Changes in population characteristics: tradition?intense cultural expectations may override the wishes of women
- 31Changes in population characteristics: education?for women in particularly female literacy is a key to lower fertility. With education comes knowledge of birth control and more opportunities for employment and wider choices
- 32Changes in population characteristics: young age structure?this leads to developing countries far outpacing developed countries in population growth
- 33Changes in population characteristics: social class?Fertility decreases from lower to higher class
- 34Changes in population characteristics: Religion?is of major significance because both Islam and the Roman Catholic church oppose the use of artificial birth control. However adherence to religious docterine tends to lessen with economic development
- 35Define mortality?the number of deaths within a particular society and within a particular time
- 36population explosion: death due to?natural causes- old age, disease and infection
Accidental death – natural hazards, pollution, accidents
Pre meditated/human conflict death – executions, war, genocide, terrorism - 37what are the Diseases of Affluence (non-communicable) MEDCs?Heart disease and stroke
Cancer
Wars: international
Transport related accidents - 38what are the Infectious diseases (communicable) LEDCs?Respiratory disease: influenza, pneumonia, tuberculosis 25% of all deaths
Paracscitic diseases: malaria, sleeping sickness 15%
Wars: civil
Natural disasters - 39population change is due to.........fertility, mortality and migration
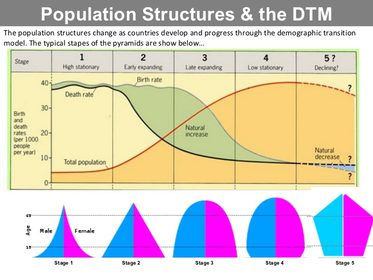
- 40The DTM describes.....................? the model was produced using....................? it suggests that the................?a sequence of changes in the relationships between Birth rates and Death rates
changes in the natural increases in several industrialised countries(western Europe Northern america)
pop growth rates for all countries can be divided in 5 stages - 41Draw the DTM and the complimenting population pyramids?
- 42Complete the table: Stage 1 Stage 2 Stage 3 Stage 4 Stage 5 fluctuation e.g. BR?/DR?High fluctuating Early expanding Late expanding Low fluctuating Declining?
e.g. Tribes in Brazil e.g. Nepal, Afghanastan e.g. Egypt e.g. USA e.g.Japan
BR High BR low BR falling BR low BR very low DR high DR falls rapidly DR falls more slowly DR low DR low - 43table contd. natural increaseNatural increase is stable
There is rapid natural increase
There is natural increase but slower than stage 2
Natural increase is stable
There is natural decrease - 44Society at each stage? stage 1+2 stage 3 stge 4+5Many child needed for farming, many child die at an early age, religious/social encouragement, no family planning
Improvement in medical care/diet fewer child needed
Family planning, good health, improving status of women, later marriages - 45Negatives of the DTMit does not include the influences of migration
it assumes that all countries will go through the same patterns
there is no time scale
reasons for birth rates and death rates are very different in different countries - 46Stage 1: high fluctuating why are countries in stage 1?little access to birth control
many children die in infancy so parents have more children to compensate
children are needed to work on the land
some religons encourage large families
Death rates are high due to diease, famine, poor diet, poor hygiene, little medical science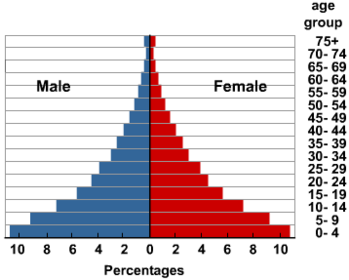
- 47Stage 1: high fluctuating Describe stage 1 population pyramidNarrow peak, few elderly people showing low life expectancy
large youthful population
wide base high birth rate
Concave sides showing high death rate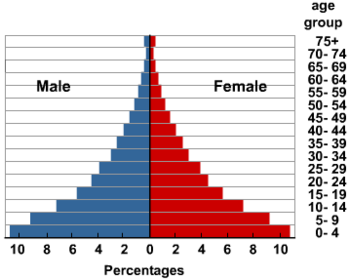
- 48Stage 2: Early expanding why are countries in stage 2?Better access healthcare(increased numberdoctor to people ratio, more gps)
improve in sanitation/ water supply to stop spread of water bourne diseases
quality and quantity of food produced improved
transport and communications improve movements of food and medical supplies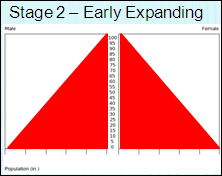
- 49Stage 2: early expanding describe stage 2 population pyramid?Decrease in infant mortality
Larger but still small elderly ratio
longer life expectancy but its still low
Flat sides indicating lower/ improvements death rates
large youthful population
wide base large Birth rate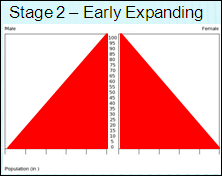
- 50Stage 3: late expanding why are countries in stage 3?more access to contraception
less infant mortality dont need bigger families, industrialisation/mechanisation so less labourers are required, wealth increases desire for material possession takes over desire large families, Equality of women means they can follow a career rather than just staying at home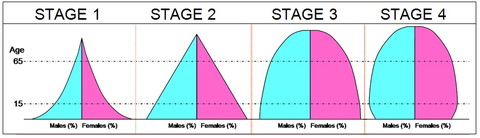
- 51Stage 3 late expanding describe stage 3 population pyramid?Much higher life expectancy
larger elderly ratio
vertical sides as DR has levelled out and BR is falling
High youthful population
large economically activ population/independent population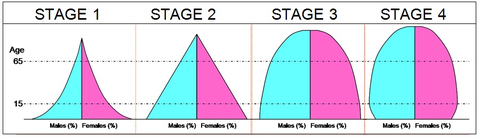
- 52Stage 4: low Fluctuating why are countries in stage 4?Rates fluctuate with baby booms, epidemics of illnesses/diseases
stage 4 have improved and it stabilises
significant changes in personal lifestyles
more women in the workforce, high personal incomes and more leisure interests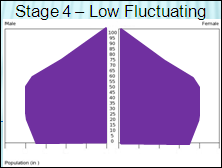
- 53Stage 4: low fluctuating describe stage 4 population pyramid?Long life expectancy
Large and increasing elderly population
independent population= largest
Convex sides low but falling DR and BR
Declining youthful population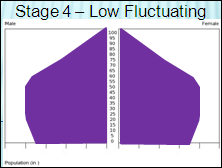
- 54Stage 5: Declining population why are countries in stage 5?Rise in women working , Greater financial independence of women
concern about impact of increased pop numbers on the resources for future generations
increase in non-traditional lifestyles, such as same-sex relationships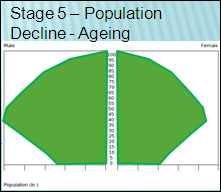
- 55Problems with an ageing population health?increased provision and therefore cost. Health costs tend to be concentrated into the last years/months of life
- 56Problems with an ageing population pensions?state pension transfers resources from the current working population to pensioners as more become entilteled to pensions the level of transfer is increased. This is unsustainable with our changing population structure.
- 57Problems with an ageing population housingsegregation of housing by age occurs in some areas particularly tenants some families have to make decisions about moving an ageing relative into a retirement home
- 58how do you work out the dependency ratio?%pop aged 0-14 + %pop aged 65+ /
% of pop aged 15-65 x100 - 59Youthful population (LEDCs) Advantages?Provide a large and cheap future workforce
Provides a growing market for manufactured products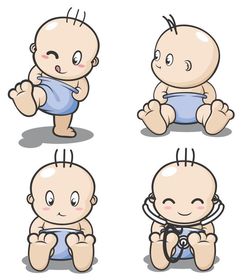
- 60youthful population disadvantages?Puts strains on available accommodation
A lack of available jobs in the future
Puts strain on food supplies
Puts strain on education and health services - 61youthful populations solutions?Family planning
Increase taxes
Industrialisation to provide jobs in manufacturing - 62Ageing Populations (MEDCs) advantages?A growing 'grey' market for leisure and health products
A larger proportion of ageing people can add experience to the workforce
Construction boom in favoured retirement locations such as the costa del sol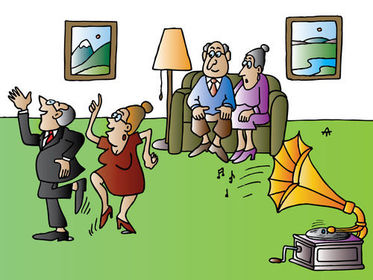
- 63Ageing populations: disadvantages?Cost of providing pensions, health care, sheltered housing leads to increased taxes on a proportionsmaller workforce
Many young people are employed caring for the elderly harming a country's competitiveness, since they are not producing goods for export
strain on available accommodation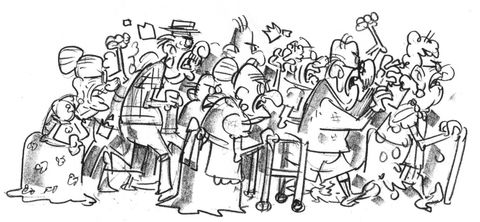
- 64Ageing populations solutions?Raise retirement age
Abolish state pensions
Sell homes of the elderly to pay for retirement care
Increase taxes
Locate retirement colonies in LEDCs - 65Impacts of youthful population: positivesLarge potential workforce
Attractive to new investors
Source of innovation and ideas
Large market for potential goods - 66impacts of youthful populations negatives?Costs of schools and clinics; Need to provide food, housing, water for a growing pop; High rates of unemploy; Large no. living in slum housing; High crime rates; countries lack the economy to take advantage of extra workers; High rate of pop growth; Political instability due to unsatisfactory living standards

- 67Define population policy? what sorts of policies are there?Definition: measure taken by a government to influence the way its population is changing
There is either a pro natalist policy or an anti natalist policies - 68Whats a pronatalist policy?A policy that tries to increase Birth rates and total fertility rates. You cannot force people to have children, so you have to offer incentives e.g. free education. They do it because they either have an ageing population OR they have a shortage of economically active pop e.g. Romania
- 69How do pro natalist policies work?You cannot physically force couples to have children so pro-natalist policies normally work by offering several incentives: Money; Extended maternity and paternity leave and pay; free or subsidised childcare; free or subsidised education and healthcare.
- 70whats and antinatalist policy?A policy that tries to reduce birth rates. This can be done through better education on family planning and better provision of contraception or a more rigid forced policy like China's.
- 71why do countries adopt an antinatalist policy?Reasons: Either the country is over populated (the population is higher than the resources available)
OR it has a youthful population (high birth rates and fertility rates) - 72migration policies In some parts of the world Migration is a means by which population can be managed what are the ways in which this is done?Either by preventing people entering a country e.g. immigration controls on the USA-Mexico border
OR: by moving people from an overpopulated area to an underpopulated area e.g. transmigration in Indonesia - 73Rural Settlements: how does the UN define urban settlements? how does the countryside agency define this?The U.N defines urban as settlements with over 20, 000 inhabitants
The countryside Agency refers to rural settlement s as those containing less than 10, 000 inhabitants - 74what are the perceptions of rurality?Chocolate box rural
-Poverty stricken rural
-Awesome rural - 75what are the characteristics to measure rurality?include data about people: their number, density, age, type of employment and income. Other criteria might be the level of services provided, the land use including open space and the accessibility of nearby towns and cities for commuters.
- 76define connurbationwhere two cities meet and join
- 77what model is this?clokes model
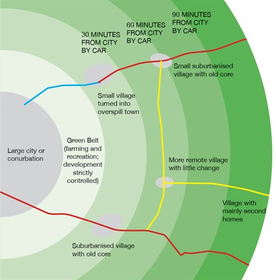
- 78An Index of Rurality: Cloke's conclusion was that beyond the urban area there were four levels of rurality which he called:Extreme rural: remote areas e.g. lake district; Intermediate rural: still very rural like south Devon; Intermediate non-rural: with growing urban influence as in Northamptonshire or Bedfordshire; Extreme Non-rural: rural urban fringe areas around London e.g. in Hertfordshire
- 79—
Información
- Descripción
- AS - Level Geography Fichas sobre population notes, creado por annabel.jennings el 31/03/2016.
- Creado por
- annabel.jennings
- Visitas
- 0
- Valoración