
Mapa mental
Break-even Point
Contenido del mapa
Break-even Point
Revenue = Number of sales x Price
TC = FC + VC
Profit + TR> TC
Loss = TR < TC
Break - even point = FIXED COSTS/ SELLING PRICE - VARIABLE COSTS (contribution)
Working out contribution
- Selling price - variable costs
- Work out how many units need selling to pay FC and breakeven
- Fixed Costs/Contribution = No of units.
Impact of changes on a business
- Increase in FC/VC causes BEP to increase
- Decrease in FC/VC causes BEP to decrease
- Increase in Selling price causes BEP to decrease
- Decrease in Selling price causes BEP to Increase
When FC change
- Rent Increase:
- Increase staff salaries
- Insurance increase
- Rent Increase:
Change in VC
- Supplier may increase goods
- Wasting materials due to faulty goods
- Increased VAt
- Staff wage increase
- Paying overtime
When Selling Prices change
- A competitor has a big promotion and take your customers
- Not selling products because they're too expensive
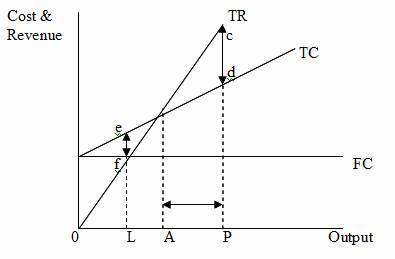
Drawing BE charts
- Involve drawing three lines
- Fixed costs
- Total costs
- Total revenue
- Involve drawing three lines
Margin of safety
- Actual sales - Break-even output= margin of safety
Imágenes y archivos del mapa
Información
- Descripción
- GCSE Business Mapa Mental sobre Break-even Point, creado por Gee_0599 el 29/09/2014.
- Creado por
- Gee_0599 · sep 2014
- Actualizado
- 28 abr 2017
- Visitas
- 66
- Etiquetas
- Valoración