
Mapa mental
Week 7
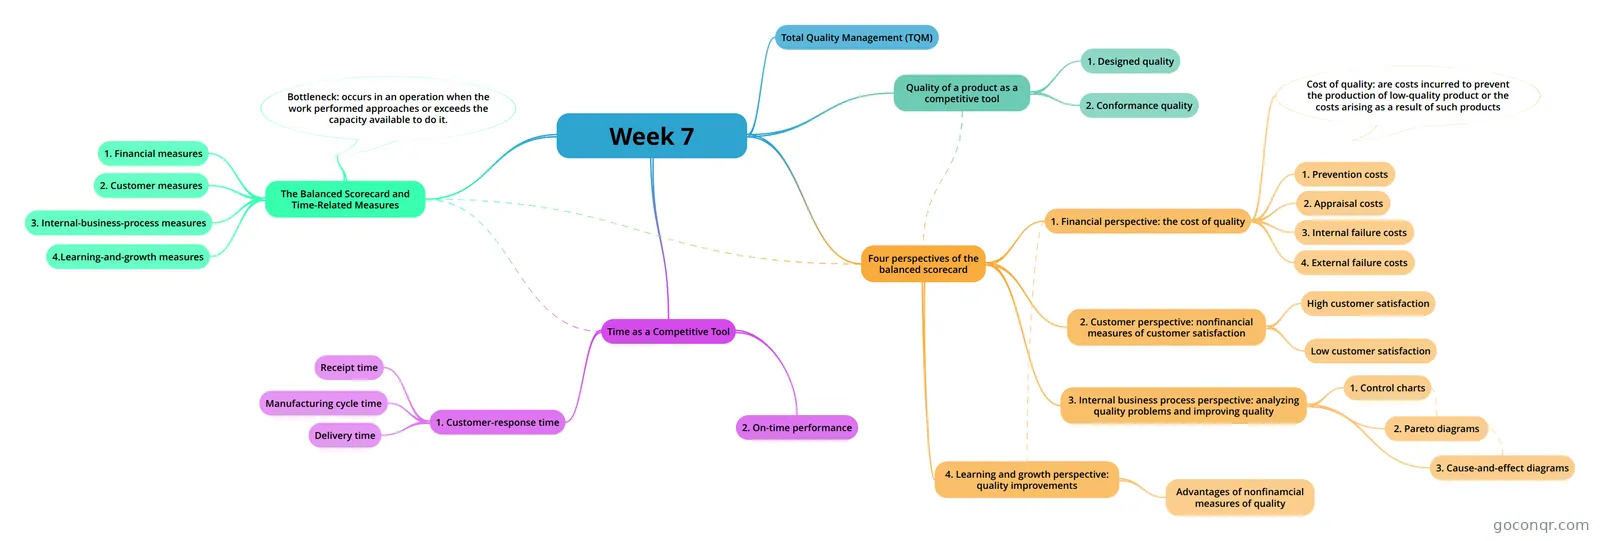
Mind map: Total Quality Management and Balanced Scorecard Perspectives
Contenido del mapa
Week 7
Total Quality Management (TQM)
- TQM: Total Quality Management (TQM) is the continual process of detecting and reducing or eliminating errors in manufacturing, streamlining supply chain management, improving the customer experience, and ensuring that employees are up to speed with their training. Total quality management aims to hold all parties involved in the production process accountable for the overall quality of the final product or service.Read more:
Quality of a product as a competitive tool
- Focusing on the quality of a product or service will: •build expertise in producing it •lower the costs of making it •create customer satisfaction •generate higher future revenues
- There are 2 aspects of quality: 1. Designed quality 2. Conformance quality
- 1. Designed quality
- Designed quality refers to how closely the characteristics of a product or service meet the needs and wants of customers
- 2. Conformance quality
- Conformance quality is the performance of a product or service relative to its design and product specification. Example: Apple's products generally have excellent conformance quality; rarely do the products fail to do what they are suppose to do. However, Iphone 5's maps were a feature desired by customers but the map app did not perform according to its specifications.
Four perspectives of the balanced scorecard
- 1. Financial perspective: the cost of quality
- Financial measures (revenue and income growth) affect quality. The most direct financial measurement is cost of quality (COQ). COQ:These are costs incurred to prevent the production of a low-quality product of costs arising as a result of low-quality products which include: 1. Prevention costs 2. Appraisal costs 3. Internal failure costs 4. External failure costs
- COQ are useful because they: •Help managers reduce cost and improve quality •Place a dollar figure on the costs of poor quality •Help prioritise quality improvement programs •Help managers monitor the effects of the ‘quality effort’ •Can help identify the optimal level of quality for the firm
- 3. Internal failure costs
- Costs incurred to defective products before they are shipped to customers. Example: - Scrap - Rework - Downtime - Material disposal
- 4. External failure costs
- Costs incurred on defective products after they have been shipped to customers. Example: - Sales return - Warranty claims - Processing customer complaints
- 2. Appraisal costs
- Costs incurred to detect which of the individual units of products do not conform to specifications. Example: - Monitoring - Inspecting materials - Inspecting work in process - Inspecting finished goods
- 1. Prevention costs
- Costs incurred to prevent the production of products that do not conform to specifications. Example: - Quality engineering - Quality planning - Employee training
- Cost of quality: are costs incurred to prevent the production of low-quality product or the costs arising as a result of such products
- 2. Customer perspective: nonfinancial measures of customer satisfaction
- Nonfinancial Measures of Customer Satisfaction include: •Surveys on satisfaction •Market share •Number of defective units shipped to customers •Number of customer complaints •Product fail rates •Delivery delays / On-time deliveries
- High customer satisfaction
- Higher customer satisfaction should lead to lower external failure costs, lower costs of quality, and higher revenues due to greater customer retention, loyalty, and positive word-of-mouth advertising.
- Low customer satisfaction
- Lower customer satisfaction indicates that external failure costs and costs of quality will likely increase in the future.
- 3. Internal business process perspective: analyzing quality problems and improving quality
- There are 3 techniques for for identifying and analyzing quality problems: 1. Control charts 2. Pareto Diagrams 3. Cause-and-effect diagrams
- 1. Control charts
- Statistical Quality Control (SQC) is a formal means of distinguishing between random and nonrandom variations in an operating process. Random variations: - When chance causes defective products to be produced. Nonrandom variations: - Defective products as a result of systematic problem.
- Control Charts are a graph of a series of successive observations of a particular step,procedure, or operation taken at regular intervals of time. Each observation is plotted relative to specified ranges that represent the limits within which observations are expected to fall. Only those observations outside the control limits are ordinarily regarded as nonrandom and worth investigating.
- 2. Pareto diagrams
- Observations outside control limits serve as inputs for a Pareto Diagram. Pareto Diagram – a chart that indicates how frequently each type of defect occurs, ordered from the most frequent to the least frequent.
- 3. Cause-and-effect diagrams
- The most frequently recurring costly problems identified by the Pareto diagram are analyzed using cause-and-effect diagrams. Cause-and-effect diagrams: - identifies potential causes and defects using a diagram that resembles the bone structure of a fish.
- 4. Learning and growth perspective: quality improvements
- Most businesses believe that the drivers of internal-businss-process quality include: - recruiting outstanding employees - greater employee empowerment - provide more employee training - lowering employee turnover etc... will all reduce the number of defective products. To create and maintain this culture, managers encourage them to strive to improve quality and eliminate the root causes of defects by measuring the following factors in the learning-and-growth perspective in a balance scorecard which are: - Employee turnover ratio - Employee empowerment (The number of processes in which employees have the right to make decisions without consulting supervisors.) - Employee satisfaction - Employee training
- Advantages of nonfinamcial measures of quality
- •Nonfinancial measures of quality are often easy to quantify and understand. •Nonfinancial measures direct attention to physical processes and to areas that need improvement. •Nonfinancial measures provide immediate feedback on whether quality-improvement efforts have succeeded. •Nonfinancial measures are useful indicators of future long-run performance.
- 1. Financial perspective: the cost of quality
Time as a Competitive Tool
- Companies view time as a driver of strategy. Managers need to measure time to manage it properly. There are 2 operational measures of time: 1. Customer-response time 2. On-time performance
- Measures relating to products and services: •New product development time: Time from identification of initial concept to release of product to the market. •Break-even time (BET): The time from identification of initial concept to when a product has generated enough profit to pay back the original investment. •Time taken to fulfil a customer’s order. •Measures of customer response time, order receipt time, production lead time (cycle time). •Reliability in meeting scheduled delivery dates.
- 1. Customer-response time
- Customer-response time is how long it takes from the time a customer places an order for a product or service to the time the product of service is delivered to the customer. There are several components to customer-response time.
- Receipt time
- Receipt time is how long it takes the marketing department to specify to the manufacturer department the exact requirements of the customer's order.
- Manufacturing cycle time
- How long it takes from the time an order is received by manufacturing to the time a finished good is produced. Manufacturing cycle time is the sum of waiting time and manufacturing time for an order.
- Delivery time
- How long it takes to deliver a completed order to a customer.
- 2. On-time performance
- On-time performance is the delivery of a product or service by the time it is scheduled to be delivered.
The Balanced Scorecard and Time-Related Measures
- The structure of the balanced scorecard perspective is used to summarize how financial and non-financial measures of time relate to one another, reduce delays, and increase the output of bottleneck operations. Managers use both financial and non-financial measures to manage the performance of their firms along the time dimension. Financial measures: - they use revenue and cost measures to evaluate the financial effects of increases and decreases in customer-response time. Non-financial measures: - This helps managers evaluate how well they have done on goals such as improving manufacturing cycle-times and customer-response times.
- 1. Financial measures
- Financial Measures: - Revenue losses or price discounts attributable to delays - Carrying costs of inventories - Throughput contribution minus operating costs
- 2. Customer measures
- Customer Measures: - Customer-response time - On-time performance
- 3. Internal-business-process measures
- Internal Business Process Measures: - Average manufacturing time for key products - Idle time at bottleneck operations - Defective units produced at bottleneck operations - Average reduction in setup time and processing time at bottleneck operations
- 4.Learning-and-growth measures
- Learning and Growth Measures: - Employee satisfaction - Number of employees trained in managing bottleneck operations
- Bottleneck: occurs in an operation when the work performed approaches or exceeds the capacity available to do it.
Información
- Descripción
- Performance Mangement and Control Mapa Mental sobre Week 7, creado por Micky Marshall el 24/09/2018.
- Creado por
- Micky Marshall
- Visitas
- 6
- Valoración