
Mapa mental
Descriptive Statistics
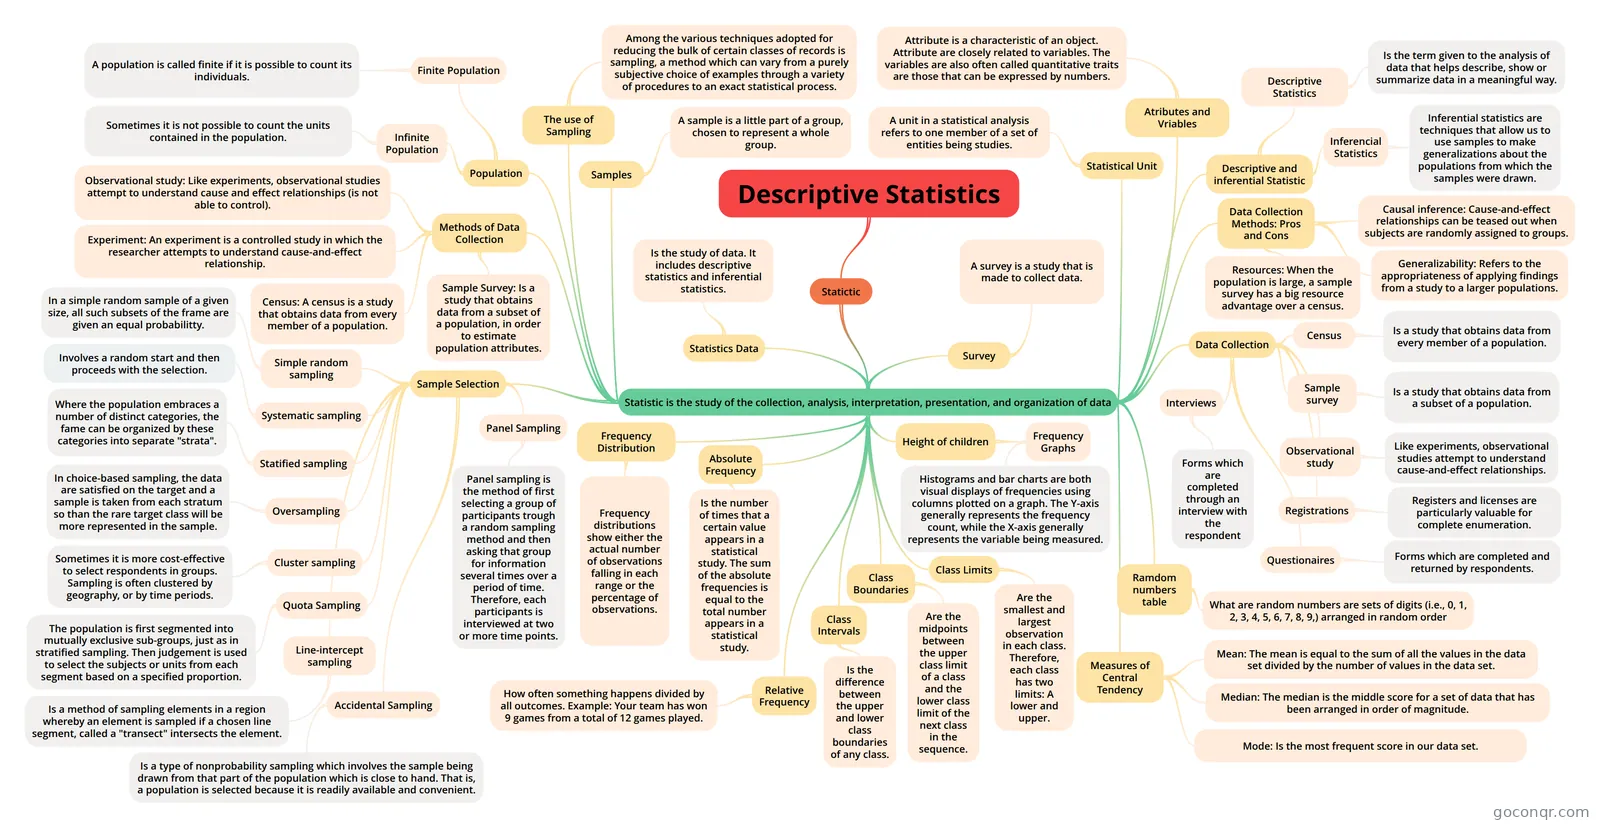
Mind map: Descriptive statistics
Contenido del mapa
Descriptive Statistics
Statictic
- Statistic is the study of the collection, analysis, interpretation, presentation, and organization of data
- Statistics Data
- Is the study of data. It includes descriptive statistics and inferential statistics.
- Survey
- A survey is a study that is made to collect data.
- Samples
- A sample is a little part of a group, chosen to represent a whole group.
- Population
- Finite Population
- A population is called finite if it is possible to count its individuals.
- Infinite Population
- Sometimes it is not possible to count the units contained in the population.
- Finite Population
- The use of Sampling
- Among the various techniques adopted for reducing the bulk of certain classes of records is sampling, a method which can vary from a purely subjective choice of examples through a variety of procedures to an exact statistical process.
- Atributes and Vriables
- Attribute is a characteristic of an object. Attribute are closely related to variables. The variables are also often called quantitative traits are those that can be expressed by numbers.
- Descriptive and inferential Statistic
- Descriptive Statistics
- Is the term given to the analysis of data that helps describe, show or summarize data in a meaningful way.
- Inferencial Statistics
- Inferential statistics are techniques that allow us to use samples to make generalizations about the populations from which the samples were drawn.
- Descriptive Statistics
- Methods of Data Collection
- Observational study: Like experiments, observational studies attempt to understand cause and effect relationships (is not able to control).
- Experiment: An experiment is a controlled study in which the researcher attempts to understand cause-and-effect relationship.
- Census: A census is a study that obtains data from every member of a population.
- Sample Survey: Is a study that obtains data from a subset of a population, in order to estimate population attributes.
- Statistical Unit
- A unit in a statistical analysis refers to one member of a set of entities being studies.
- Data Collection Methods: Pros and Cons
- Causal inference: Cause-and-effect relationships can be teased out when subjects are randomly assigned to groups.
- Generalizability: Refers to the appropriateness of applying findings from a study to a larger populations.
- Resources: When the population is large, a sample survey has a big resource advantage over a census.
- Sample Selection
- Simple random sampling
- In a simple random sample of a given size, all such subsets of the frame are given an equal probabilitty.
- Statified sampling
- Where the population embraces a number of distinct categories, the fame can be organized by these categories into separate "strata".
- Oversampling
- In choice-based sampling, the data are satisfied on the target and a sample is taken from each stratum so than the rare target class will be more represented in the sample.
- Cluster sampling
- Sometimes it is more cost-effective to select respondents in groups. Sampling is often clustered by geography, or by time periods.
- Quota Sampling
- The population is first segmented into mutually exclusive sub-groups, just as in stratified sampling. Then judgement is used to select the subjects or units from each segment based on a specified proportion.
- Accidental Sampling
- Is a type of nonprobability sampling which involves the sample being drawn from that part of the population which is close to hand. That is, a population is selected because it is readily available and convenient.
- Line-intercept sampling
- Is a method of sampling elements in a region whereby an element is sampled if a chosen line segment, called a "transect" intersects the element.
- Panel Sampling
- Panel sampling is the method of first selecting a group of participants trough a random sampling method and then asking that group for information several times over a period of time. Therefore, each participants is interviewed at two or more time points.
- Systematic sampling
- Involves a random start and then proceeds with the selection.
- Simple random sampling
- Data Collection
- Census
- Is a study that obtains data from every member of a population.
- Sample survey
- Is a study that obtains data from a subset of a population.
- Observational study
- Like experiments, observational studies attempt to understand cause-and-effect relationships.
- Registrations
- Registers and licenses are particularly valuable for complete enumeration.
- Questionaires
- Forms which are completed and returned by respondents.
- Interviews
- Forms which are completed through an interview with the respondent
- Census
- Ramdom numbers table
- What are random numbers are sets of digits (i.e., 0, 1, 2, 3, 4, 5, 6, 7, 8, 9,) arranged in random order
- Measures of Central Tendency
- Mean: The mean is equal to the sum of all the values in the data set divided by the number of values in the data set.
- Median: The median is the middle score for a set of data that has been arranged in order of magnitude.
- Mode: Is the most frequent score in our data set.
- Frequency Distribution
- Frequency distributions show either the actual number of observations falling in each range or the percentage of observations.
- Absolute Frequency
- Is the number of times that a certain value appears in a statistical study. The sum of the absolute frequencies is equal to the total number appears in a statistical study.
- Relative Frequency
- How often something happens divided by all outcomes. Example: Your team has won 9 games from a total of 12 games played.
- Height of children
- Frequency Graphs
- Histograms and bar charts are both visual displays of frequencies using columns plotted on a graph. The Y-axis generally represents the frequency count, while the X-axis generally represents the variable being measured.
- Frequency Graphs
- Class Limits
- Are the smallest and largest observation in each class. Therefore, each class has two limits: A lower and upper.
- Class Intervals
- Is the difference between the upper and lower class boundaries of any class.
- Class Boundaries
- Are the midpoints between the upper class limit of a class and the lower class limit of the next class in the sequence.
- Statistics Data
- Statistic is the study of the collection, analysis, interpretation, presentation, and organization of data